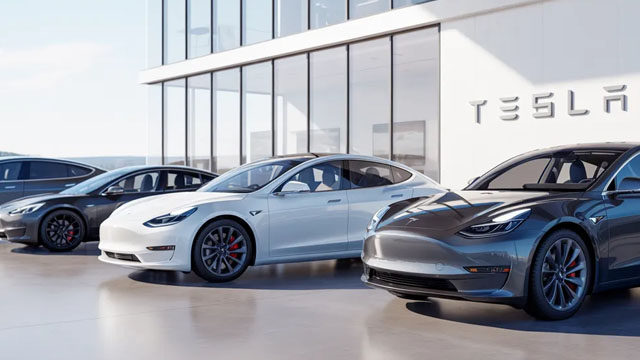
The consensus estimate calls for Tesla to deliver about 406,000 vehicles in the second quarter. That total would edge past the 384,122 vehicles delivered in the same quarter a year earlier.

Tesla, Inc. (TSLA) stock price & volume — 10-year historical chart
Investment Thesis • Updated 2026Q1
while the balance sheet remains healthy with a 0.11 D/E ratio, the current forward P/E of 200.65 and compressed 4.2% operating margins suggest that the stock is priced for a perfection that current operational volatility does not yet support.
Tesla, Inc. (TSLA) revenue, earnings & EPS growth — 3, 5 & 10-year CAGR
Tesla, Inc. (TSLA) EPS & revenue vs analyst estimates — last 4 quarters
| Quarter | Date | EPS (Act vs Est) | Revenue (Act vs Est) |
|---|---|---|---|
| Q2 2026Latest | Apr 22, 2026 | $0.41vs $0.35+15.9% | $22.4Bvs $22.1B+1.3% |
| Q1 2026 | Jan 28, 2026 | $0.50vs $0.45+9.9% | $24.9Bvs $24.8B+0.5% |
| Q4 2025 | Oct 22, 2025 | $0.50vs $0.56-10.4% | $28.1Bvs $26.5B+5.9% |
| Q3 2025 | Jul 23, 2025 | $0.40vs $0.40+0.7% | $22.5Bvs $22.3B+1.0% |
Recent stock market news and headlines for Tesla, Inc. (TSLA)
The consensus estimate calls for Tesla to deliver about 406,000 vehicles in the second quarter. That total would edge past the 384,122 vehicles delivered in the same quarter a year earlier.

The SpaceX IPO has investors asking a reasonable question: at a valuation somewhere between $1 trillion and $2 trillion, is the hype real, or is the market getting ahead of itself? Rob Spivey and Joel Litman of Altimetry Research say the answer is both—and that for most investors, there are cleaner opportunities sitting right next to the SpaceX story.

Tesla completed its blueprint for its AI5 chip. The company wants to vertically integrate to realize its vision for humanoid robots.

The company's pivot toward offering hardware access to rivals could hamstring its own AI goals.

Key metrics vs top competitors for Tesla, Inc. (TSLA)
| Company | Price | Market Cap | P/E Ratio | Rev Growth (1Y) | Net Margin | ROE | Div Yield |
|---|---|---|---|---|---|---|---|
| $402.90 | $1.51T | 373.06 | -2.93% | 4% | 4.85% | — | |
| $76.03 | $68.55B | 23.25 | -1.29% | 1.38% | 3.84% | — | |
| $13.57 | $53.18B | -6.59 | 1.23% | -3.22% | -14.71% | — | |
| $16.49 | $20.4B | -5.37 | 8.39% | -63.62% | -69.6% | — | |
| $6.00 | $1.98B | -0.50 | 67.58% | -300.36% | -193.02% | — | |
| $4.88 | $11.5B | -4.99 | 29.47% | -35.01% | -270.66% | — |
Tesla, Inc. (TSLA) vs competitors — business, growth, and fundamentals comparison against the closest industry rivals.
Tesla, Inc. (TSLA) SEC filings — annual & quarterly reports (10-K, 10-Q)
Apr 22, 2026·SEC
Apr 2, 2026·SEC
Jan 28, 2026·SEC
Get notified when TSLA posts new earnings or crosses analyst targets
Free. No account needed. Unsubscribe any time.
Tesla, Inc. (TSLA) stock FAQ — growth, dividends, profitability & financials explained
Tesla, Inc. (TSLA) reported $97.88B in revenue for fiscal year 2025. This represents a 134080722% increase from $0.1M in 2007.
Tesla, Inc. (TSLA) saw revenue decline by 2.9% over the past year.
Yes, Tesla, Inc. (TSLA) is profitable, generating $3.88B in net income for fiscal year 2025 (4.0% net margin).
Tesla, Inc. (TSLA) has a return on equity (ROE) of 4.8%. This is below average, suggesting room for improvement.
Tesla, Inc. (TSLA) generated $7.00B in free cash flow for fiscal year 2025. Positive FCF indicates the company can fund dividends, buybacks, or reinvestment.