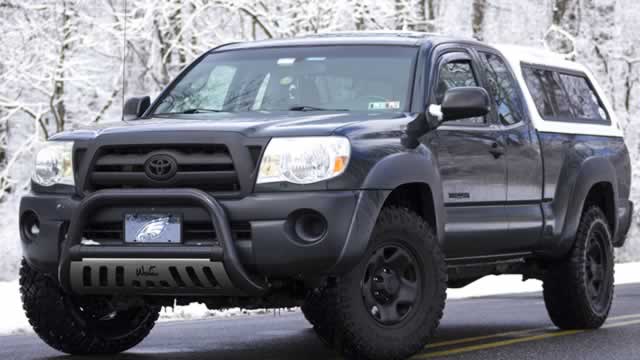
Toyota plans a $3.6 billion expansion of its Texas manufacturing campus that will add thousands of jobs and transition some Tacoma production from Mexico.

Toyota Motor Corporation (TM) stock price & volume — 10-year historical chart
Investment Thesis • Updated 2026Q4
while the company maintains a 3.6% dividend yield, the current P/FCF of 61.04 and volatile free cash flow margins suggest that the stock's valuation may be disconnected from its immediate cash-generating capabilities.
Toyota Motor Corporation (TM) revenue, earnings & EPS growth — 3, 5 & 10-year CAGR
Toyota Motor Corporation (TM) EPS & revenue vs analyst estimates — last 4 quarters
| Quarter | Date | EPS (Act vs Est) | Revenue (Act vs Est) |
|---|---|---|---|
| Q2 2026Latest | May 8, 2026 | $4.00vs $3.11+28.6% | $80.4Bvs $79.6B+1.1% |
| Q1 2026 | Feb 6, 2026 | $6.26vs $4.35+43.9% | $85.8Bvs $83.0B+3.4% |
| Q4 2025 | Nov 5, 2025 | $4.85vs $3.36+44.3% | $82.5Bvs $80.9B+2.0% |
| Q3 2025 | Aug 7, 2025 | $4.47vs $4.67-4.3% | $84.6Bvs $82.4B+2.6% |
Recent stock market news and headlines for Toyota Motor Corporation (TM)
Toyota plans a $3.6 billion expansion of its Texas manufacturing campus that will add thousands of jobs and transition some Tacoma production from Mexico.

Toyota announced a $3.6 billion expansion at its Texas truck assembly plant. Trump said the investment came because of his policies: "That's what tariffs do.

Toyota Motor Corp said on Monday it will build a new $3.6 billion auto plant in Texas and shift some truck production to the United States from Mexico.

The automaker will boost vehicle production at its San Antonio truck and SUV plant.

Toyota Motor said it is investing $3.6 billion to move production of the Tacoma midsize pickup truck from Mexico to Texas. The San Antonio plant currently produces the Toyota Tundra full-size pickup truck, including a hybrid variant, and the Toyota Sequoia SUV hybrid.

Key metrics vs top competitors for Toyota Motor Corporation (TM)
| Company | Price | Market Cap | P/E Ratio | Rev Growth (1Y) | Net Margin | ROE | Div Yield |
|---|---|---|---|---|---|---|---|
| $179.43 | $233.86B | 9.28 | 11.88% | 7.59% | 10.45% | 3.47% | |
| $76.03 | $68.55B | 23.25 | -1.29% | 1.38% | 3.84% | — | |
| $13.57 | $53.18B | -6.59 | 1.23% | -3.22% | -14.71% | — | |
| $5.81 | $16.83B | -0.66 | 14.93% | -0.42% | -1.81% | — | |
| $28.50 | $36.98B | -13.68 | 6.56% | -1.99% | -3.51% | — | |
| $402.90 | $1.51T | 373.06 | -2.93% | 3.96% | 4.75% | — |
Toyota Motor Corporation (TM) vs competitors — business, growth, and fundamentals comparison against the closest industry rivals.
Get notified when TM posts new earnings or crosses analyst targets
Free. No account needed. Unsubscribe any time.
Toyota Motor Corporation (TM) stock FAQ — growth, dividends, profitability & financials explained
Toyota Motor Corporation (TM) reported $51.16T in revenue for fiscal year 2026. This represents a 319% increase from $12.22T in 1997.
Toyota Motor Corporation (TM) grew revenue by 11.9% over the past year. This is steady growth.
Yes, Toyota Motor Corporation (TM) is profitable, generating $3.89T in net income for fiscal year 2026 (7.6% net margin).
Yes, Toyota Motor Corporation (TM) pays a dividend with a yield of 3.47%. This makes it attractive for income-focused investors.
Toyota Motor Corporation (TM) has a return on equity (ROE) of 10.5%. This is reasonable for most industries.
Toyota Motor Corporation (TM) generated $469.87B in free cash flow for fiscal year 2026. Positive FCF indicates the company can fund dividends, buybacks, or reinvestment.