VCP ScannerFree US Stock Screener & Financial AnalysisFree US Stock Screener
ScreenerThemes
DCF ValuationCalculate intrinsic value of US stocks
Market ValuationBuffett indicator, CAPE & macro gauges
Total ReturnSee dividends + price return history
DCA CalculatorSimulate recurring buys & compounding
Earnings
FAANG & Tech
AAPL vs MSFTNVDA vs AMDGOOGL vs META
Cloud & Cyber
CRM vs NOWCRWD vs PANWSNOW vs DDOG
Consumer & Auto
TSLA vs FAMZN vs WMTNFLX vs DIS
Finance & Crypto
JPM vs BACV vs MACOIN vs MSTR
Pharma & Energy
LLY vs NVOJNJ vs PFEXOM vs CVX
Compare Any Stocks...
WatchlistInsider
ScreenerThemes
Earnings
WatchlistInsider
PM
← Back to Screener
VCP ScannerFree US Stock Screener & Financial Analysis

Find stocks. Verify deeply. Act with conviction.

Data updated daily

Product

  • Screener
  • Themes
  • Valuation
  • Total Return
  • DCA Calculator
  • News
  • Earnings

Resources

  • Market Valuation
  • Compare
  • Insider Activity
  • Methodology
  • How It Works
  • Glossary
  • Learn

Get Ideas

Get weekly stock ideas — free

© 2026 VCP Scanner
AboutPrivacyTerms
Not financial advice. Do your own research.
ScreenerNewsCompareWatchlist
PMPhilip Morris International Inc.
$187.79$292.7B
Overview & Verdict
OverviewShould I Buy?
Valuation & Forecasts
Valuation ModelsEstimatesDCF Model
Price & Analyst Data
Analyst TargetsPrice HistoryTechnical Analysis
Financial Statements
Income StatementBalance SheetCash FlowRatios & Margins
Performance
P/E HistoryRevenue HistoryEarnings HistoryDividend HistoryTotal Return
Ownership
Holders

PM logoPhilip Morris International Inc.(PM)Earnings, Financials & Key Ratios

PM•NYSE
$187.79
25.9× P/E·Price updated Jul 7, 2026
SectorConsumer DefensiveIndustryTobaccoSub-IndustryBranded tobacco and nicotine products
AboutPhilip Morris International Inc. operates as a tobacco company working to delivers a smoke-free future and evolving portfolio for the long-term to include products outside of the tobacco and nicotine sector. The company's product portfolio primarily consists of cigarettes and smoke-free products, including heat-not-burn, vapor, and oral nicotine products that are sold in markets outside the United States. The company offers its smoke-free products under the HEETS, HEETS Creations, HEETS Dimensions, HEETS Marlboro, HEETS FROM MARLBORO, Marlboro Dimensions, Marlboro HeatSticks, Parliament HeatSticks, and TEREA brands, as well as the KT&G-licensed brands, Fiit, and Miix. It also sells its products under the Marlboro, Parliament, Bond Street, Chesterfield, L&M, Lark, and Philip Morris brands. In addition, the company owns various cigarette brands, such as Dji Sam Soe, Sampoerna A, and Sampoerna U in Indonesia; and Fortune and Jackpot in the Philippines. The company sells its smoke-free products in 71 markets. Philip Morris International Inc. was incorporated in 1987 and is headquartered in New York, New York.Show more

  • Revenue$40.65B+7.3%
  • EBITDA$16.93B+11.5%
  • Net Income$11.35B+61.3%
  • EPS (Diluted)7.26+60.6%
  • Gross Margin67.12%+3.6%
  • EBITDA Margin41.65%+3.9%
  • Operating Margin36.74%+3.8%
  • Net Margin27.92%+50.3%

PM Price & Volume

Philip Morris International Inc. (PM) stock price & volume — 10-year historical chart

Loading chart...

Smoke-Free Pivot Drives Growth Amid Leverage

Investment Thesis • Updated 2026Q1

VerdictNeutral
Growth:Expanding
Profitability:Strong
Financial:Strained
Cash Flow:Mixed
Primary Risk:Regulatory and leverage constraints

Key Thesis Takeaways

  • Philip Morris International is successfully executing a strategic transition toward smoke-free products, evidenced by a 9.1% year-over-year revenue increase in 2026Q1.
  • While the company demonstrates robust pricing power with gross margins reaching 68.1%, investors must weigh this against a persistent negative equity position of $9.3 billion and significant debt levels of $51.9 billion.
  • Future performance remains contingent on navigating regulatory scrutiny in key markets and stabilizing volatile cash flow conversion cycles.

Verdict Logic

while the company maintains a strong 68.1% gross margin, the combination of a 0.98 current ratio and $51.9 billion in total debt warrants caution regarding long-term solvency.

PM Growth Metrics

Philip Morris International Inc. (PM) revenue, earnings & EPS growth — 3, 5 & 10-year CAGR

Revenue CAGR

10 Years4.26%
5 Years7.21%
3 Years8.57%
TTM8.09%

Profit CAGR

10 Years5.14%
5 Years7.09%
3 Years7.84%
TTM46.02%

EPS CAGR

10 Years5.09%
5 Years7.07%
3 Years7.71%
TTM46.3%

Return on Capital

10 Years44.38%
5 Years40.1%
3 Years34.05%
Last Year36.15%

PM Recent Earnings

Philip Morris International Inc. (PM) EPS & revenue vs analyst estimates — last 4 quarters

Full history →
●Beat EPS 10/12 qtrs (83%)●Beat Revenue 10/12 qtrs (83%)
Q2 2026Latest
Apr 22, 2026
Metric
Actual
Est
EPS
$1.96+5.4%
$1.86
Rev
$10.1B+1.9%
$10.0B
Q1 2026
Feb 6, 2026
Metric
Actual
Est
EPS
$1.70+0.0%
$1.70
Rev
$10.4B-0.4%
$10.4B
Q4 2025
Oct 21, 2025
Metric
Actual
Est
EPS
$2.24+7.2%
$2.09
Rev
$10.8B+2.0%
$10.6B
Q3 2025
Jul 22, 2025
Metric
Actual
Est
EPS
$1.91+2.7%
$1.86
Rev
$10.1B-1.7%
$10.3B
QuarterDateEPS (Act vs Est)Revenue (Act vs Est)
Q2 2026LatestApr 22, 2026
$1.96vs $1.86+5.4%
$10.1Bvs $10.0B+1.9%
Q1 2026Feb 6, 2026
$1.70vs $1.70+0.0%
$10.4Bvs $10.4B-0.4%
Q4 2025Oct 21, 2025
$2.24vs $2.09+7.2%
$10.8Bvs $10.6B+2.0%
Q3 2025Jul 22, 2025
$1.91vs $1.86+2.7%
$10.1Bvs $10.3B-1.7%
Based on last 12 quarters of dataView full earnings history →

Latest PM News

Recent stock market news and headlines for Philip Morris International Inc. (PM)

The Motley Fool·1 day ago
Altria vs. Philip Morris International: Tobacco Still Makes a Great Stock. Which Is a Better Buy in 2026?

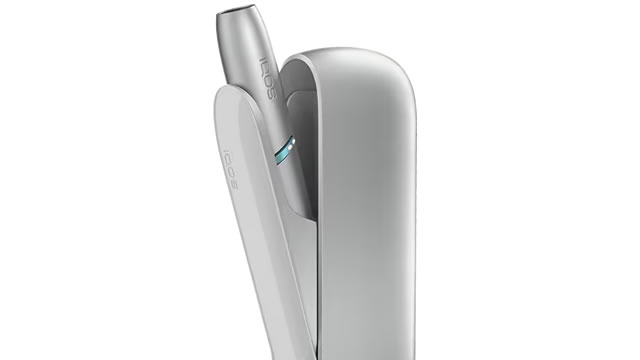
Altria maintains strong domestic dominance through its Marlboro brand and generates significant free cash flow from its U.S. operations. Philip Morris International is aggressively expanding its global smoke-free portfolio with brands like IQOS and ZYN in over 100 markets.

Fool - Investing News·6 days ago
My Top High-Yield Dividend Stock to Buy for Passive Income, Even If There's a Stock Market Crash

Anchor your portfolio with this high-yield Dividend King.

CNBC·Jun 30, 2026
FDA lets Philip Morris market Zyn nicotine pouches as less harmful than cigarettes

The FDA will allow 20 Philip Morris-owned Zyn nicotine pouch products to carry a modified-risk claim saying switching from cigarettes lowers the risk of several smoking-related diseases. The decision gives Philip Morris a major marketing win for one of the fastest-growing nicotine products as cigarette sales decline in the U.S.

Business Wire·Jun 30, 2026
FDA Issues Modified Risk Tobacco Product Orders for 20 ZYN Nicotine Pouch Products

STAMFORD, CT--(BUSINESS WIRE)--Philip Morris International Inc. (PMI) (NYSE: PM) today announced that the U.S. Food and Drug Administration (FDA) issued Modified Risk Tobacco Product (MRTP) orders for 20 variants of ZYN nicotine pouch products. These are the first MRTP orders granted for nicotine pouches, allowing PMI U.S. to market the following claim for the authorized ZYN products: “Using ZYN instead of cigarettes puts you at a lower risk of mouth cancer, heart disease, lung cancer, stroke,.

The Motley Fool·Jun 30, 2026
Altria vs. Philip Morris International: Which Consumer Goods Stock Is a Better Buy in 2026?

Altria maintains a dominant position in the U.S. tobacco market with industry-leading net margins and a massive domestic distribution network. Philip Morris International is leading the global shift to smoke-free products with its Iqos and ZYN platforms across more than 100 markets.

Peers Comparison

Key metrics vs top competitors for Philip Morris International Inc. (PM)

Full Screener →
CompanyPriceMarket CapP/E RatioRev Growth (1Y)Net MarginROEDiv Yield
PM logoPMPhilip Morris International Inc.Current
$187.79$292.68B25.877.31%27.92%—2.95%
MO logoMOAltria Group, Inc.
$72.96$121.98B17.75-1.49%36.91%——
BTI logoBTIBritish American Tobacco p.l.c.
$61.80$133.88B13.23-0.99%21.04%21.69%—
XXII logoXXII22nd Century Group, Inc.
$4.36$1.5M-0.08-40.66%-44.9%-25.03%—
TPVG logoTPVGTriplePoint Venture Growth BDC Corp.
$4.75$192.85M3.8936.55%-19.55%-3.39%—
UVV logoUVVUniversal Corporation
$51.66$1.29B39.74-0.77%1.12%2.18%—

Compare PM vs Peers

Philip Morris International Inc. (PM) vs competitors — business, growth, and fundamentals comparison against the closest industry rivals.

Closest Rival

vs MO

Most directly comparable listed peer for PM.

Scale Benchmark

vs WMT

Larger-name benchmark to compare PM against a more recognizable public peer.

Peer Set

Compare Top 5

vs MO, BTI, XXII, TPVG

PM SEC Filings & Documents

Philip Morris International Inc. (PM) SEC filings — annual & quarterly reports (10-K, 10-Q)

8-K Announcements

6
Material company update

Apr 22, 2026·SEC

Material company update

Mar 13, 2026·SEC

Material company update

Mar 5, 2026·SEC

10-K Annual Reports

2
FY 2026

Feb 6, 2026·SEC

FY 2025

Feb 6, 2025·SEC

10-Q Quarterly Reports

5
FY 2026

Apr 24, 2026·SEC

FY 2025

Oct 24, 2025·SEC

FY 2025

Jul 25, 2025·SEC

Get notified when PM posts new earnings or crosses analyst targets

Free. No account needed. Unsubscribe any time.

Free. Unsubscribe any time.

PM Frequently Asked Questions

Philip Morris International Inc. (PM) stock FAQ — growth, dividends, profitability & financials explained

Growth & Financials
What is Philip Morris International Inc.'s revenue?

Philip Morris International Inc. (PM) reported $41.49B in revenue for fiscal year 2025. This represents a 24% increase from $33.39B in 2003.

How fast is Philip Morris International Inc. growing?

Philip Morris International Inc. (PM) grew revenue by 7.3% over the past year. This is steady growth.

Is PM profitable?

Yes, Philip Morris International Inc. (PM) is profitable, generating $11.10B in net income for fiscal year 2025 (27.9% net margin).

Dividend & Returns
Does PM pay dividends?

Yes, Philip Morris International Inc. (PM) pays a dividend with a yield of 2.95%. This makes it attractive for income-focused investors.

What is Philip Morris International Inc.'s free cash flow?

Philip Morris International Inc. (PM) generated $10.67B in free cash flow for fiscal year 2025. Positive FCF indicates the company can fund dividends, buybacks, or reinvestment.

What if you invested $1,000 in PM back in 2003?

Total return calculator · dividends reinvested · 23+ years of data

See returns →