VCP ScannerFree US Stock Screener & Financial AnalysisFree US Stock Screener
ScreenerThemes
DCF ValuationCalculate intrinsic value of US stocks
Market ValuationBuffett indicator, CAPE & macro gauges
Total ReturnSee dividends + price return history
DCA CalculatorSimulate recurring buys & compounding
Earnings
FAANG & Tech
AAPL vs MSFTNVDA vs AMDGOOGL vs META
Cloud & Cyber
CRM vs NOWCRWD vs PANWSNOW vs DDOG
Consumer & Auto
TSLA vs FAMZN vs WMTNFLX vs DIS
Finance & Crypto
JPM vs BACV vs MACOIN vs MSTR
Pharma & Energy
LLY vs NVOJNJ vs PFEXOM vs CVX
Compare Any Stocks...
WatchlistInsider
ScreenerThemes
Earnings
WatchlistInsider
LRCX
← Back to Screener
VCP ScannerFree US Stock Screener & Financial Analysis

Find stocks. Verify deeply. Act with conviction.

Data updated daily

Product

  • Screener
  • Themes
  • Valuation
  • Total Return
  • DCA Calculator
  • News
  • Earnings

Resources

  • Market Valuation
  • Compare
  • Insider Activity
  • Methodology
  • How It Works
  • Glossary
  • Learn

Get Ideas

Get weekly stock ideas — free

© 2026 VCP Scanner
AboutPrivacyTerms
Not financial advice. Do your own research.
ScreenerNewsCompareWatchlist
LRCXLam Research Corporation
$350.20$437.3B
Overview & Verdict
OverviewShould I Buy?
Valuation & Forecasts
Valuation ModelsEstimatesDCF Model
Price & Analyst Data
Analyst TargetsPrice HistoryTechnical Analysis
Financial Statements
Income StatementBalance SheetCash FlowRatios & Margins
Performance
P/E HistoryRevenue HistoryEarnings HistoryDividend HistoryTotal Return
Ownership
Holders

LRCX logoLam Research Corporation(LRCX)Earnings, Financials & Key Ratios

LRCX•NASDAQ
$350.20
84.4× P/E·Price updated Jul 6, 2026
SectorTechnologyIndustrySemiconductorsSub-IndustrySemiconductor Manufacturing Equipment
AboutLam Research Corporation designs, manufactures, markets, refurbishes, and services semiconductor processing equipment used in the fabrication of integrated circuits. The company offers ALTUS systems to deposit conformal films for tungsten metallization applications; SABRE electrochemical deposition products for copper interconnect transition that offers copper damascene manufacturing; SOLA ultraviolet thermal processing products for film treatments; and VECTOR plasma-enhanced CVD ALD products. It also provides SPEED gapfill high-density plasma chemical vapor deposition products; and Striker single-wafer atomic layer deposition products for dielectric film solutions. In addition, the company offers Flex for dielectric etch applications; Kiyo for conductor etch applications; Syndion for through-silicon via etch applications; and Versys metal products for metal etch processes. Further, it provides Coronus bevel clean products to enhance die yield; Da Vinci, DV-Prime, EOS, and SP series products to address various wafer cleaning applications; and Metryx mass metrology systems for high precision in-line mass measurement in semiconductor wafer manufacturing. The company sells its products and services to semiconductors industry in the United States, China, Europe, Japan, Korea, Southeast Asia, Taiwan, and internationally. Lam Research Corporation was incorporated in 1980 and is headquartered in Fremont, California.Show more
  • Revenue$18.44B+23.7%
  • EBITDA$6.29B+36.0%
  • Net Income$5.36B+40.0%
  • EPS (Diluted)4.15+43.1%
  • Gross Margin48.7%+2.9%
  • EBITDA Margin34.1%+9.9%
  • Operating Margin32.01%+11.9%
  • Net Margin29.06%+13.2%
  • ROE58.24%+27.4%

LRCX Price & Volume

Lam Research Corporation (LRCX) stock price & volume — 10-year historical chart

Loading chart...

Cyclical Recovery Drives Robust Margin Expansion Potential

Investment Thesis • Updated 2026Q3

VerdictNeutral
Growth:Accelerating
Profitability:Strong
Financial:Healthy
Cash Flow:Robust
Primary Risk:Geopolitical export control exposure

Key Thesis Takeaways

  • Lam Research is currently benefiting from a strong cyclical recovery in semiconductor capital equipment, evidenced by 23.8% year-over-year revenue growth in 2026Q3.
  • The company's strategic focus on high-aspect-ratio etching technology has enabled operating margins to scale to 35.0%, reflecting significant operating leverage.
  • However, investors should monitor the volatility in cash conversion, as the OCF/NI ratio dropped to 0.63 in 2026Q3, alongside potential geopolitical risks associated with export controls.

Verdict Logic

while the company demonstrates strong operating leverage with a 35.0% operating margin, the current P/E of 91.35 suggests a premium valuation that may already price in significant future growth.

LRCX Growth Metrics

Lam Research Corporation (LRCX) revenue, earnings & EPS growth — 3, 5 & 10-year CAGR

Revenue CAGR

10 Years13.36%
5 Years12.91%
3 Years2.29%
TTM26.53%

Profit CAGR

10 Years23.38%
5 Years18.93%
3 Years5.18%
TTM44%

EPS CAGR

10 Years27.35%
5 Years22.41%
3 Years8.27%
TTM47.63%

Return on Capital

10 Years30.78%
5 Years37.73%
3 Years35.95%
Last Year40.44%

LRCX Recent Earnings

Lam Research Corporation (LRCX) EPS & revenue vs analyst estimates — last 4 quarters

Full history →
●Beat EPS 11/12 qtrs (92%)●Beat Revenue 11/12 qtrs (92%)
Q2 2026Latest
Apr 22, 2026
Metric
Actual
Est
EPS
$1.47+8.1%
$1.36
Rev
$5.8B+1.6%
$5.8B
Q1 2026
Jan 28, 2026
Metric
Actual
Est
EPS
$1.27+8.5%
$1.17
Rev
$5.3B+2.1%
$5.2B
Q4 2025
Oct 22, 2025
Metric
Actual
Est
EPS
$1.26+3.3%
$1.22
Rev
$5.3B+1.9%
$5.2B
Q3 2025
Jul 30, 2025
Metric
Actual
Est
EPS
$1.33+9.9%
$1.21
Rev
$5.2B+3.3%
$5.0B
QuarterDateEPS (Act vs Est)Revenue (Act vs Est)
Q2 2026LatestApr 22, 2026
$1.47vs $1.36+8.1%
$5.8Bvs $5.8B+1.6%
Q1 2026Jan 28, 2026
$1.27vs $1.17+8.5%
$5.3Bvs $5.2B+2.1%
Q4 2025Oct 22, 2025
$1.26vs $1.22+3.3%
$5.3Bvs $5.2B+1.9%
Q3 2025Jul 30, 2025
$1.33vs $1.21+9.9%
$5.2Bvs $5.0B+3.3%
Based on last 12 quarters of dataView full earnings history →

Latest LRCX News

Recent stock market news and headlines for Lam Research Corporation (LRCX)

Zacks Investment Research·Jun 26, 2026
Earnings Growth & Price Strength Make Lam Research (LRCX) a Stock to Watch

The Zacks Focus List offers investors a way to easily find top-rated stocks and build a winning investment portfolio. Here's why you should take advantage.
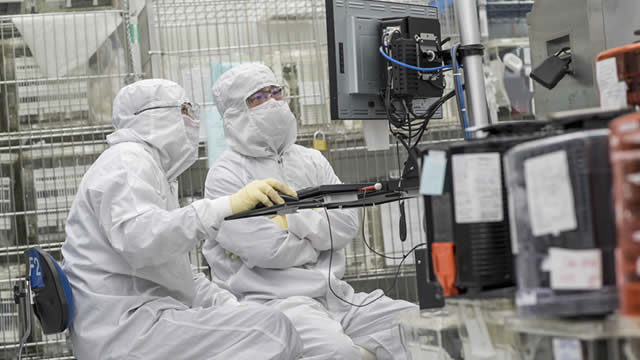
247 Wallst·Jun 25, 2026
Live Nasdaq Composite: Micron Lifts Market Boat Alongside Cooling Inflation Signal

Live Updates Act now: the analyst who called NVIDIA in 2010 just named his top 10 AI stocks - and Apple didn't make the cut. Grab the names FREE today. Cooling Inflation 19 minutes ago Live May's Personal Consumption Expenditures (PCE) price index offered a measured dose of relief, with the Federal Reserve's preferred inflation... Live Nasdaq Composite: Micron Lifts Market Boat Alongside Cooling Inflation Signal

Invezz·Jun 24, 2026
Forget Nvidia: Philippe Laffont reveals his preferred way to gain AI exposure

The likes of Nvidia (NVDA) and Micron (MU) remain the front and center of all AI-related debates in 2026, but billionaire investor Philippe Laffont is approaching the boom from a different angle. Speaking recently with CNBC, the founder of Coatue Management revealed his $90 billion hedge fund prefers a classic “picks-and-shovels” strategy rather than wagering on individual chipmakers like NVDA.

Zacks Investment Research·Jun 23, 2026
Lam Research (LRCX) Registers a Bigger Fall Than the Market: Important Facts to Note

Lam Research (LRCX) concluded the recent trading session at $371.33, signifying a -9.33% move from its prior day's close.

InvestorPlace·Jun 23, 2026
Today's Memory Selloff: Opportunity or Warning Sign?

Memory stocks get nailed

Peers Comparison

Key metrics vs top competitors for Lam Research Corporation (LRCX)

Full Screener →
CompanyPriceMarket CapP/E RatioRev Growth (1Y)Net MarginROEDiv Yield
LRCX logoLRCXLam Research CorporationCurrent
$350.20$437.32B84.3923.68%29.06%58.24%0.25%
AMAT logoAMATApplied Materials, Inc.
$592.79$470.65B68.454.39%29.31%39.78%—
KLAC logoKLACKLA Corporation
$233.31$304.77B76.8223.89%35.66%89.07%—
ASML logoASMLASML Holding N.V.
$1825.07$703.41B64.6815.58%29.71%51.95%—
TER logoTERTeradyne, Inc.
$427.34$66.9B122.8013.13%22.55%29.72%—
ONTO logoONTOOnto Innovation Inc.
$303.86$15.12B109.301.82%10.33%5.19%—

Compare LRCX vs Peers

Lam Research Corporation (LRCX) vs competitors — business, growth, and fundamentals comparison against the closest industry rivals.

Closest Rival

vs AMAT

Most directly comparable listed peer for LRCX.

Scale Benchmark

vs NVDA

Larger-name benchmark to compare LRCX against a more recognizable public peer.

Peer Set

Compare Top 5

vs AMAT, KLAC, ASML, TER

LRCX SEC Filings & Documents

Lam Research Corporation (LRCX) SEC filings — annual & quarterly reports (10-K, 10-Q)

8-K Announcements

6
Material company update

Apr 22, 2026·SEC

Material company update

Feb 3, 2026·SEC

Material company update

Jan 28, 2026·SEC

10-K Annual Reports

3
FY 2025

Aug 11, 2025·SEC

FY 2024

Aug 29, 2024·SEC

FY 2023

Aug 15, 2023·SEC

10-Q Quarterly Reports

6
FY 2026

Apr 23, 2026·SEC

FY 2026

Jan 29, 2026·SEC

FY 2025

Oct 24, 2025·SEC

Get notified when LRCX posts new earnings or crosses analyst targets

Free. No account needed. Unsubscribe any time.

Free. Unsubscribe any time.

LRCX Frequently Asked Questions

Lam Research Corporation (LRCX) stock FAQ — growth, dividends, profitability & financials explained

Growth & Financials
What is Lam Research Corporation's revenue?

Lam Research Corporation (LRCX) reported $21.68B in revenue for fiscal year 2025. This represents a 1555% increase from $1.31B in 1996.

How fast is Lam Research Corporation growing?

Lam Research Corporation (LRCX) grew revenue by 23.7% over the past year. This is strong growth.

Is LRCX profitable?

Yes, Lam Research Corporation (LRCX) is profitable, generating $6.71B in net income for fiscal year 2025 (29.1% net margin).

Dividend & Returns
Does LRCX pay dividends?

Yes, Lam Research Corporation (LRCX) pays a dividend with a yield of 0.25%. This makes it attractive for income-focused investors.

What is LRCX's return on equity?

Lam Research Corporation (LRCX) has a return on equity (ROE) of 58.2%. This is excellent, indicating efficient use of shareholder capital.

What is Lam Research Corporation's free cash flow?

Lam Research Corporation (LRCX) generated $6.45B in free cash flow for fiscal year 2025. Positive FCF indicates the company can fund dividends, buybacks, or reinvestment.

What if you invested $1,000 in LRCX back in 1996?

Total return calculator · dividends reinvested · 30+ years of data

See returns →