Zacks Investment Research·Jun 26, 2026
Onto Innovation (ONTO) Suffers a Larger Drop Than the General Market: Key InsightsIn the latest trading session, Onto Innovation (ONTO) closed at $323.92, marking a -5.9% move from the previous day.

 Onto Innovation Inc.(ONTO)Earnings, Financials & Key Ratios
Onto Innovation Inc. (ONTO) stock price & volume — 10-year historical chart
Investment Thesis • Updated 2026Q1
while the company maintains a strong liquidity position with a current ratio of 6.15 as of 2026Q1, the high forward P/E of 45.02 and volatile earnings quality warrant a cautious approach until operating margins stabilize.
Onto Innovation Inc. (ONTO) revenue, earnings & EPS growth — 3, 5 & 10-year CAGR
Onto Innovation Inc. (ONTO) EPS & revenue vs analyst estimates — last 4 quarters
| Quarter | Date | EPS (Act vs Est) | Revenue (Act vs Est) |
|---|---|---|---|
| Q2 2026Latest | May 5, 2026 | $1.42vs $1.42+0.0% | $292Mvs $292M-0.0% |
| Q1 2026 | Feb 19, 2026 | $1.26vs $1.28-1.6% | $267Mvs $267M-0.2% |
| Q4 2025 | Nov 6, 2025 | $0.92vs $0.89+2.9% | $218Mvs $220M-0.9% |
| Q3 2025 | Aug 7, 2025 | $1.25vs $1.27-1.6% | $254Mvs $222M+14.5% |
Recent stock market news and headlines for Onto Innovation Inc. (ONTO)
In the latest trading session, Onto Innovation (ONTO) closed at $323.92, marking a -5.9% move from the previous day.
Onto Innovation which has surged by over 260% and has outperformed the Russell 1000 by 10x over the past year, is still deemed worthy of a buy rating. ONTO is positioned across front-end and back-end semiconductor manufacturing, with over 60% of revenue now AI compute-related, with >$1B worth of opportunities ahead. Operating margins which are at 26.7% are poised to expand to 30% by the end of the year, as advanced node opportunities pick up.

On June 23, 2026, Onto Innovation Inc (ONTO) shares fell 9.2% today, closing at $315.88. This move comes after a strong year of performance, with shares up 236.

Onto Innovation and KLA are riding AI-driven chip demand, but their growth paths, valuations and advanced packaging exposure differ.
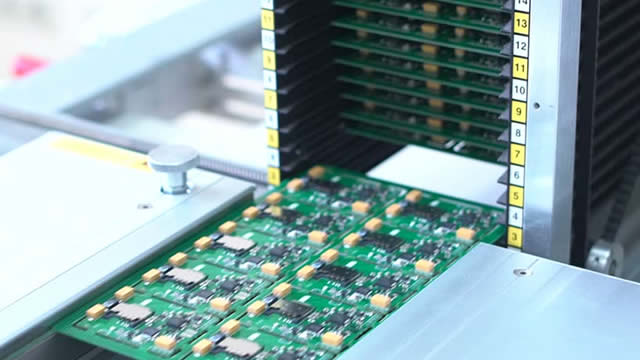
ONTO is benefiting from AI-driven advanced packaging demand with Dragonfly G5 adoption, expanding customer wins and a pipeline targeting new market share.
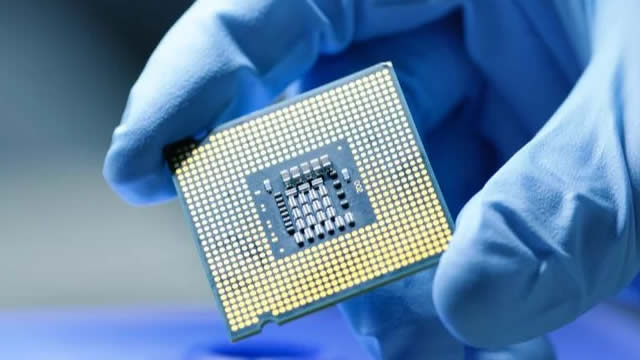
Key metrics vs top competitors for Onto Innovation Inc. (ONTO)
| Company | Price | Market Cap | P/E Ratio | Rev Growth (1Y) | Net Margin | ROE | Div Yield |
|---|---|---|---|---|---|---|---|
| $351.36 | $17.48B | 126.39 | 1.82% | 13.6% | 6.79% | — | |
| $133.81 | $7B | 9999.00 | -7.38% | 0.4% | 0.37% | — | |
| $69.11 | $3.25B | -43.47 | 12.74% | -11.54% | -6.84% | — | |
| $147.13 | $11.47B | 213.23 | 2.8% | 8.14% | 6.68% | — | |
| $117.16 | $7.76B | 85.52 | 15.24% | 9.48% | 5.13% | — | |
| $155.48 | $7.16B | 149.50 | 15.57% | 28.36% | 23.49% | — |
Onto Innovation Inc. (ONTO) vs competitors — business, growth, and fundamentals comparison against the closest industry rivals.
Onto Innovation Inc. (ONTO) SEC filings — annual & quarterly reports (10-K, 10-Q)
May 5, 2026·SEC
Apr 21, 2026·SEC
Apr 16, 2026·SEC
Get notified when ONTO posts new earnings or crosses analyst targets
Free. No account needed. Unsubscribe any time.
Onto Innovation Inc. (ONTO) stock FAQ — growth, dividends, profitability & financials explained
Onto Innovation Inc. (ONTO) reported $1.03B in revenue for fiscal year 2025. This represents a 3301% increase from $30.3M in 1996.
Onto Innovation Inc. (ONTO) grew revenue by 1.8% over the past year. Growth has been modest.
Yes, Onto Innovation Inc. (ONTO) is profitable, generating $106.4M in net income for fiscal year 2025 (13.6% net margin).
Onto Innovation Inc. (ONTO) has a return on equity (ROE) of 6.8%. This is below average, suggesting room for improvement.
Onto Innovation Inc. (ONTO) generated $238.8M in free cash flow for fiscal year 2025. Positive FCF indicates the company can fund dividends, buybacks, or reinvestment.