Benzinga·13h ago
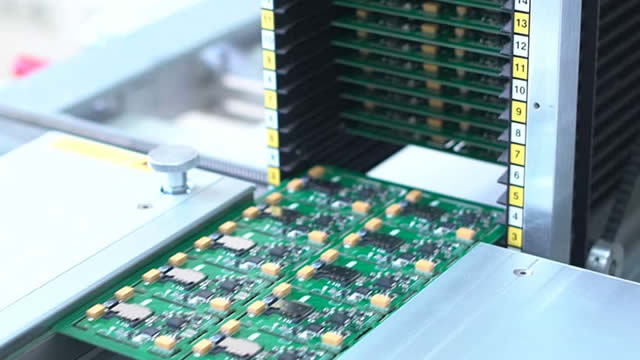
Chip Rout Drags Nasdaq 100 Lower, Oil Climbs: Stock Market TodayA deepening sell-off in chip and memory stocks dragged all four major U.S. equity indexes lower by midday Tuesday.
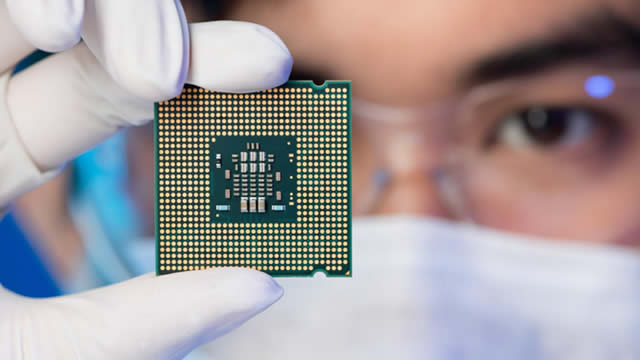
 Applied Materials, Inc.(AMAT)Earnings, Financials & Key Ratios
Applied Materials, Inc. (AMAT) stock price & volume — 10-year historical chart
Applied Materials, Inc. (AMAT) revenue, earnings & EPS growth — 3, 5 & 10-year CAGR
Applied Materials, Inc. (AMAT) EPS & revenue vs analyst estimates — last 4 quarters
| Quarter | Date | EPS (Act vs Est) | Revenue (Act vs Est) |
|---|---|---|---|
| Q2 2026Latest | May 14, 2026 | $2.86vs $2.68+6.7% | $7.9Bvs $7.7B+3.0% |
| Q1 2026 | Feb 12, 2026 | $2.38vs $2.21+7.7% | $7.0Bvs $6.9B+2.1% |
| Q4 2025 | Dec 12, 2025 | $2.17vs $2.11+2.8% | $6.8Bvs $6.7B+1.7% |
| Q3 2025 | Aug 14, 2025 | $2.48vs $2.36+5.1% | $7.3Bvs $7.2B+1.1% |
Recent stock market news and headlines for Applied Materials, Inc. (AMAT)
A deepening sell-off in chip and memory stocks dragged all four major U.S. equity indexes lower by midday Tuesday.
After a 284% rebound from its 52-week low, Applied Materials still has AI-driven demand, portfolio breadth and earnings momentum supporting further growth.
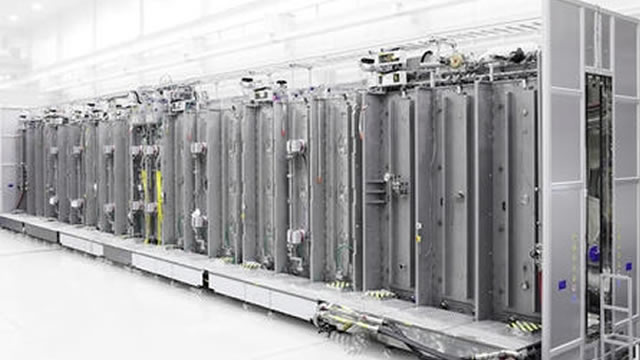
AMAT, ONTO and BSET made it to the Zacks Rank #1 (Strong Buy) momentum stocks list on July 7, 2026.
Shares of Intel (NASDAQ:INTC | INTC Price Prediction) are down 10% in Tuesday morning trading to $110, while Advanced Micro Devices (NASDAQ:AMD) stock is off 8% to $508.

SK Hynix, the world's second-largest memory-chip maker, is coming to the NASDAQ on Friday with the largest stock sale anyone has priced in years, and the chip complex is already pricing it in.
Key metrics vs top competitors for Applied Materials, Inc. (AMAT)
| Company | Price | Market Cap | P/E Ratio | Rev Growth (1Y) | Net Margin | ROE | Div Yield |
|---|---|---|---|---|---|---|---|
| $554.50 | $440.25B | 64.03 | 4.39% | 24.67% | 35.51% | 0.31% | |
| $326.13 | $407.26B | 78.59 | 23.68% | 30.94% | 65.79% | — | |
| $216.47 | $282.77B | 71.28 | 23.89% | 35.66% | 89.07% | — | |
| $1747.28 | $673.43B | 61.88 | 15.58% | 29.71% | 51.95% | — | |
| $279.93 | $13.92B | 100.69 | 1.82% | 10.33% | 5.19% | — | |
| $446.43 | $14.19B | 56.08 | 30.96% | 29.21% | 21.21% | — |
Applied Materials, Inc. (AMAT) vs competitors — business, growth, and fundamentals comparison against the closest industry rivals.
Applied Materials, Inc. (AMAT) SEC filings — annual & quarterly reports (10-K, 10-Q)
May 14, 2026·SEC
Mar 13, 2026·SEC
Feb 12, 2026·SEC
Get notified when AMAT posts new earnings or crosses analyst targets
Free. No account needed. Unsubscribe any time.
Applied Materials, Inc. (AMAT) stock FAQ — growth, dividends, profitability & financials explained
Applied Materials, Inc. (AMAT) reported $29.02B in revenue for fiscal year 2025. This represents a 600% increase from $4.14B in 1996.
Applied Materials, Inc. (AMAT) grew revenue by 4.4% over the past year. Growth has been modest.
Yes, Applied Materials, Inc. (AMAT) is profitable, generating $8.51B in net income for fiscal year 2025 (24.7% net margin).
Yes, Applied Materials, Inc. (AMAT) pays a dividend with a yield of 0.31%. This makes it attractive for income-focused investors.
Applied Materials, Inc. (AMAT) has a return on equity (ROE) of 35.5%. This is excellent, indicating efficient use of shareholder capital.
Applied Materials, Inc. (AMAT) generated $5.96B in free cash flow for fiscal year 2025. Positive FCF indicates the company can fund dividends, buybacks, or reinvestment.