Zacks Investment Research·Jun 30, 2026
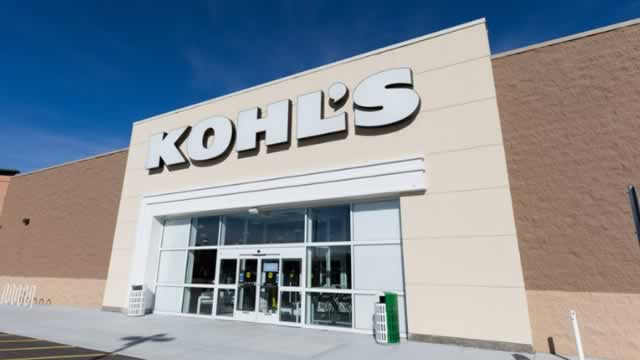
Kohl's Juniors Sales Jump 10%: Is So. Becoming a Growth Engine?Kohl's juniors sales rise 10% in Q1, led by So., as proprietary brands gain traction despite softer company-wide comparable sales.
 Kohl's Corporation(KSS)Earnings, Financials & Key Ratios
Kohl's Corporation (KSS) stock price & volume — 10-year historical chart
Investment Thesis • Updated 2026Q1
the company's inability to generate consistent profitability outside of the fourth quarter, highlighted by a net loss of $14.0 million in 2026Q1, suggests that the current business model remains fundamentally challenged.
Kohl's Corporation (KSS) revenue, earnings & EPS growth — 3, 5 & 10-year CAGR
Kohl's Corporation (KSS) EPS & revenue vs analyst estimates — last 4 quarters
| Quarter | Date | EPS (Act vs Est) | Revenue (Act vs Est) |
|---|---|---|---|
| Q2 2026Latest | May 28, 2026 | $0.13vs $0.18+27.8% | $3.0Bvs $3.0B+0.3% |
| Q2 2026 | Mar 10, 2026 | $1.07vs $0.86+24.4% | $5.0Bvs $5.0B-0.9% |
| Q4 2025 | Nov 25, 2025 | $0.10vs $0.13+176.9% | $3.6Bvs $3.3B+7.6% |
| Q3 2025 | Aug 27, 2025 | $0.56vs $0.33+69.7% | $3.5Bvs $3.4B+3.8% |
Recent stock market news and headlines for Kohl's Corporation (KSS)
Kohl's juniors sales rise 10% in Q1, led by So., as proprietary brands gain traction despite softer company-wide comparable sales.
Kohl's went from a household name to a plunging stock as it lost relevancy and its core customer. Now, the company is trying to turn itself around and return to a position of growth by leaning into the business strategies that originally worked, according to CEO Michael Bender.
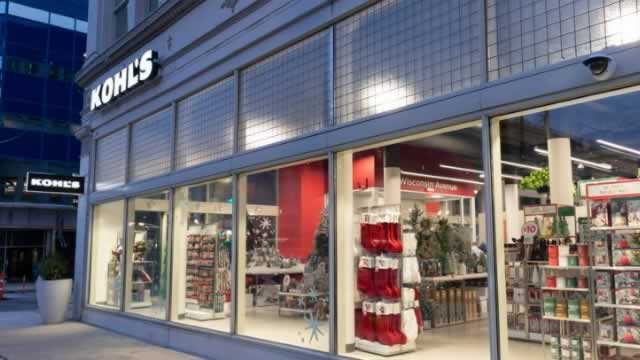
TJX and KSS highlight contrasting retail strategies as shifting consumer spending reshapes growth and competition.

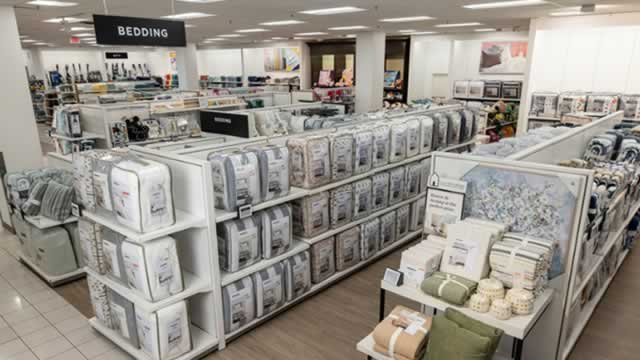
Kohl's proprietary brands lift comps 6% in Q1 and help expand gross margin, but higher digital shipping costs offset much of the profitability boost.
Kohl's rally, proprietary-brand gains, digital investments and tighter cost controls lift investor confidence despite demand risks.
Key metrics vs top competitors for Kohl's Corporation (KSS)
| Company | Price | Market Cap | P/E Ratio | Rev Growth (1Y) | Net Margin | ROE | Div Yield |
|---|---|---|---|---|---|---|---|
| $16.76 | $1.88B | 7.07 | -4.28% | 1.75% | 6.93% | 2.91% | |
| $23.13 | $6.08B | 9.97 | -1.67% | 2.94% | 14.44% | — | |
| $521.45 | $8.14B | 14.31 | -0.41% | 9.95% | 33.85% | — | |
| $42.69 | $2.2B | 10.31 | 6.58% | 16.85% | 47.36% | — | |
| $316.12 | $19.9B | 33.24 | 8.76% | 5.24% | 37.72% | — | |
| $154.11 | $170.57B | 31.58 | 7.12% | 9.4% | 59.66% | — |
Kohl's Corporation (KSS) vs competitors — business, growth, and fundamentals comparison against the closest industry rivals.
Kohl's Corporation (KSS) SEC filings — annual & quarterly reports (10-K, 10-Q)
May 28, 2026·SEC
May 21, 2026·SEC
May 20, 2026·SEC
Get notified when KSS posts new earnings or crosses analyst targets
Free. No account needed. Unsubscribe any time.
Kohl's Corporation (KSS) stock FAQ — growth, dividends, profitability & financials explained
Kohl's Corporation (KSS) reported $15.46B in revenue for fiscal year 2025. This represents a 547% increase from $2.39B in 1996.
Kohl's Corporation (KSS) saw revenue decline by 4.3% over the past year.
Yes, Kohl's Corporation (KSS) is profitable, generating $272.0M in net income for fiscal year 2025 (1.8% net margin).
Yes, Kohl's Corporation (KSS) pays a dividend with a yield of 2.91%. This makes it attractive for income-focused investors.
Kohl's Corporation (KSS) has a return on equity (ROE) of 6.9%. This is below average, suggesting room for improvement.
Kohl's Corporation (KSS) generated $1.21B in free cash flow for fiscal year 2025. Positive FCF indicates the company can fund dividends, buybacks, or reinvestment.