Zacks Investment Research·19h ago
Is AVO's Sustainable Growth Strategy Built for the Long Run?Mission Produce is betting on diversified sourcing, category expansion and the Calavo deal to drive sustainable growth beyond avocado market volatility.
 Mission Produce, Inc.(AVO)Earnings, Financials & Key Ratios
Mission Produce, Inc. (AVO) stock price & volume — 10-year historical chart
Investment Thesis • Updated 2026Q2
the company's inability to maintain positive operating income, which resulted in a $7.2 million net loss in 2026Q2, combined with a -10.0% free cash flow margin, indicates significant operational instability.
Mission Produce, Inc. (AVO) revenue, earnings & EPS growth — 3, 5 & 10-year CAGR
Mission Produce, Inc. (AVO) EPS & revenue vs analyst estimates — last 4 quarters
| Quarter | Date | EPS (Act vs Est) | Revenue (Act vs Est) |
|---|---|---|---|
| Q3 2026Latest | Jun 8, 2026 | $0.10vs $0.05-287.5% | $291Mvs $256M+13.5% |
| Q2 2026 | Mar 12, 2026 | $0.01vs $0.07-85.7% | $279Mvs $261M+6.9% |
| Q4 2025 | Dec 18, 2025 | $0.31vs $0.23+34.8% | $319Mvs $294M+8.5% |
| Q4 2025 | Sep 8, 2025 | $0.26vs $0.13+100.0% | $358Mvs $320M+11.7% |
Recent stock market news and headlines for Mission Produce, Inc. (AVO)
Mission Produce is betting on diversified sourcing, category expansion and the Calavo deal to drive sustainable growth beyond avocado market volatility.
AVO and LMNR differ in scale, crop exposure, asset mix and growth drivers as investors compare their fundamentals.
Director Jay Pack acquired 40,000 shares of Common Stock on June 30, 2026, at around $12.10 per share for a transaction value of ~$484,000. Total direct ownership rose to 579,965 shares while indirect holdings were unaffected.
AVO's blueberries segment is gaining momentum as volumes, pricing and Peruvian infrastructure use support its long-term growth strategy.
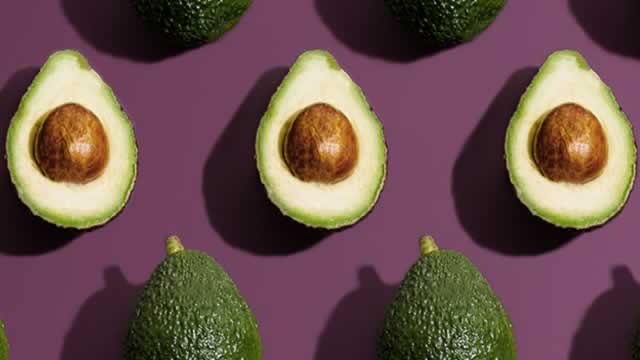
As a vertically integrated avocado supplier, Mission Produce attracted notable insider buying amid a year of modest share price declines.

Key metrics vs top competitors for Mission Produce, Inc. (AVO)
| Company | Price | Market Cap | P/E Ratio | Rev Growth (1Y) | Net Margin | ROE | Div Yield |
|---|---|---|---|---|---|---|---|
| $13.45 | $950.35M | 25.38 | 12.68% | 2.71% | 6.3% | — | |
| $26.09 | $466.33M | 23.50 | -1.98% | 2.61% | 7.76% | — | |
| $10.38 | $2.87B | 16.48 | 16.43% | 20.69% | 18.54% | — | |
| $14.20 | $1.35B | 20.58 | 8.23% | 0.46% | 2.88% | — | |
| $115.50 | $18.14B | 52.98 | 8.61% | 0.49% | 7.13% | — | |
| $98.21 | $4B | 58.46 | 9.36% | 1.87% | 13.54% | — |
Mission Produce, Inc. (AVO) vs competitors — business, growth, and fundamentals comparison against the closest industry rivals.
Mission Produce, Inc. (AVO) SEC filings — annual & quarterly reports (10-K, 10-Q)
Jun 8, 2026·SEC
May 29, 2026·SEC
May 22, 2026·SEC
Get notified when AVO posts new earnings or crosses analyst targets
Free. No account needed. Unsubscribe any time.
Mission Produce, Inc. (AVO) stock FAQ — growth, dividends, profitability & financials explained
Mission Produce, Inc. (AVO) reported $1.25B in revenue for fiscal year 2025. This represents a 45% increase from $859.9M in 2018.
Mission Produce, Inc. (AVO) grew revenue by 12.7% over the past year. This is steady growth.
Yes, Mission Produce, Inc. (AVO) is profitable, generating $22.8M in net income for fiscal year 2025 (2.7% net margin).
Mission Produce, Inc. (AVO) has a return on equity (ROE) of 6.3%. This is below average, suggesting room for improvement.
Mission Produce, Inc. (AVO) generated $34.3M in free cash flow for fiscal year 2025. Positive FCF indicates the company can fund dividends, buybacks, or reinvestment.