Zacks Investment Research·Jun 30, 2026
5 Small and Mid-Cap AI Stocks to Buy That Have Skyrocketed in 1H 2026BAND, AIP, PENG, ATEN and VECO are among small- and mid-cap AI stocks that surged in 1H 2026 with more room to grow in 2H.
 Veeco Instruments Inc.(VECO)Earnings, Financials & Key Ratios
Veeco Instruments Inc. (VECO) stock price & volume — 10-year historical chart
Investment Thesis • Updated 2026Q1
the company's inability to maintain positive operating income, evidenced by a $2.7 million loss in 2026Q1, combined with a high forward P/E of 43.46, suggests limited upside potential in the near term.
Veeco Instruments Inc. (VECO) revenue, earnings & EPS growth — 3, 5 & 10-year CAGR
Veeco Instruments Inc. (VECO) EPS & revenue vs analyst estimates — last 4 quarters
| Quarter | Date | EPS (Act vs Est) | Revenue (Act vs Est) |
|---|---|---|---|
| Q2 2026Latest | May 5, 2026 | $0.14vs $0.20-30.0% | $158Mvs $160M-1.1% |
| Q1 2026 | Feb 25, 2026 | $0.24vs $0.25-4.0% | $165Mvs $165M-0.0% |
| Q4 2025 | Nov 5, 2025 | $0.36vs $0.28+28.6% | $166Mvs $166M-0.2% |
| Q3 2025 | Aug 6, 2025 | $0.36vs $0.22+63.6% | $166Mvs $159M+4.5% |
Recent stock market news and headlines for Veeco Instruments Inc. (VECO)
BAND, AIP, PENG, ATEN and VECO are among small- and mid-cap AI stocks that surged in 1H 2026 with more room to grow in 2H.
Kulicke and Soffa , Ultra Clean and Veeco have been highlighted in this Industry Outlook article.
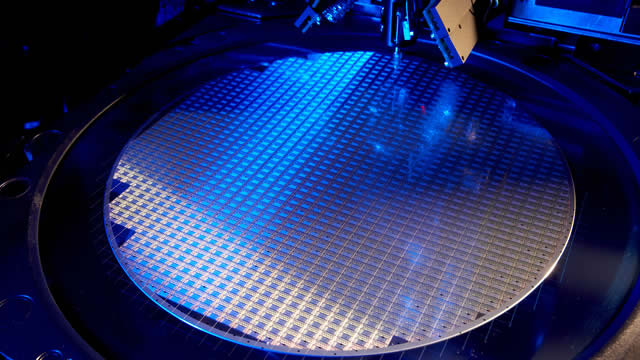
The Zacks Electronics - Manufacturing Machinery industry participants, such as KLIC, UCTT and VECO, are benefiting from strong demand for high-performance computing, advanced packaging and AI-driven demand amid challenging macroeconomic conditions.

This semiconductor equipment maker, known for advanced deposition and etch systems, just reported a notable insider sale in SEC filings.

Veeco Instruments, a supplier of semiconductor process equipment, reported a notable insider sale amid a year of sharp stock gains.

Key metrics vs top competitors for Veeco Instruments Inc. (VECO)
| Company | Price | Market Cap | P/E Ratio | Rev Growth (1Y) | Net Margin | ROE | Div Yield |
|---|---|---|---|---|---|---|---|
| $53.35 | $3.26B | 90.42 | -7.39% | 5.33% | 4.27% | — | |
| $90.78 | $4.13B | -22.70 | -2.08% | -9.38% | -25.39% | — | |
| $94.66 | $6.27B | 69.09 | 15.24% | 9.48% | 5.13% | — | |
| $279.93 | $13.92B | 100.69 | 1.82% | 10.33% | 5.19% | — | |
| $58.15 | $2.7B | -118.67 | -11.11% | -14.69% | -4.89% | — | |
| $50.97 | $2.39B | -32.06 | 12.74% | -11.54% | -6.84% | — |
Veeco Instruments Inc. (VECO) vs competitors — business, growth, and fundamentals comparison against the closest industry rivals.
Veeco Instruments Inc. (VECO) SEC filings — annual & quarterly reports (10-K, 10-Q)
May 7, 2026·SEC
May 5, 2026·SEC
Feb 25, 2026·SEC
Get notified when VECO posts new earnings or crosses analyst targets
Free. No account needed. Unsubscribe any time.
Veeco Instruments Inc. (VECO) stock FAQ — growth, dividends, profitability & financials explained
Veeco Instruments Inc. (VECO) reported $655.3M in revenue for fiscal year 2025. This represents a 577% increase from $96.8M in 1996.
Veeco Instruments Inc. (VECO) saw revenue decline by 7.4% over the past year.
Yes, Veeco Instruments Inc. (VECO) is profitable, generating $23.1M in net income for fiscal year 2025 (5.3% net margin).
Veeco Instruments Inc. (VECO) has a return on equity (ROE) of 4.3%. This is below average, suggesting room for improvement.
Veeco Instruments Inc. (VECO) generated $42.9M in free cash flow for fiscal year 2025. Positive FCF indicates the company can fund dividends, buybacks, or reinvestment.