VCP ScannerFree US Stock Screener & Financial AnalysisFree US Stock Screener
ScreenerThemes
DCF ValuationCalculate intrinsic value of US stocks
Market ValuationBuffett indicator, CAPE & macro gauges
Total ReturnSee dividends + price return history
DCA CalculatorSimulate recurring buys & compounding
Earnings
FAANG & Tech
AAPL vs MSFTNVDA vs AMDGOOGL vs META
Cloud & Cyber
CRM vs NOWCRWD vs PANWSNOW vs DDOG
Consumer & Auto
TSLA vs FAMZN vs WMTNFLX vs DIS
Finance & Crypto
JPM vs BACV vs MACOIN vs MSTR
Pharma & Energy
LLY vs NVOJNJ vs PFEXOM vs CVX
Compare Any Stocks...
WatchlistInsider
ScreenerThemes
Earnings
WatchlistInsider
AMAT
← Back to Screener
VCP ScannerFree US Stock Screener & Financial Analysis

Find stocks. Verify deeply. Act with conviction.

Data updated daily

Product

  • Screener
  • Themes
  • Valuation
  • Total Return
  • DCA Calculator
  • News
  • Earnings

Resources

  • Market Valuation
  • Compare
  • Insider Activity
  • Methodology
  • How It Works
  • Glossary
  • Learn

Get Ideas

Get weekly stock ideas — free

© 2026 VCP Scanner
AboutPrivacyTerms
Not financial advice. Do your own research.
ScreenerNewsCompareWatchlist
AMATApplied Materials, Inc.
$554.50$440.3B
Overview & Verdict
OverviewShould I Buy?
Valuation & Forecasts
Valuation ModelsEstimatesDCF Model
Price & Analyst Data
Analyst TargetsPrice HistoryTechnical Analysis
Financial Statements
Income StatementBalance SheetCash FlowRatios & Margins
Performance
P/E HistoryRevenue HistoryEarnings HistoryDividend HistoryTotal Return
Ownership
Holders

AMAT logoApplied Materials, Inc.(AMAT)Earnings, Financials & Key Ratios

AMAT•NASDAQ
$554.50
64.0× P/E·Price updated Jul 7, 2026
SectorTechnologyIndustrySemiconductorsSub-IndustrySemiconductor Manufacturing Equipment
AboutApplied Materials, Inc. provides manufacturing equipment, services, and software to the semiconductor, display, and related industries. It operates through three segments: Semiconductor Systems, Applied Global Services, and Display and Adjacent Markets. The Semiconductor Systems segment develops, manufactures, and sells various manufacturing equipment that is used to fabricate semiconductor chips or integrated circuits. This segment also offers various technologies, including epitaxy, ion implantation, oxidation/nitridation, rapid thermal processing, physical vapor deposition, chemical vapor deposition, chemical mechanical planarization, electrochemical deposition, atomic layer deposition, etching, and selective deposition and removal, as well as metrology and inspection tools. The Applied Global Services segment provides integrated solutions to optimize equipment and fab performance and productivity comprising spares, upgrades, services, remanufactured earlier generation equipment, and factory automation software for semiconductor, display, and other products. The Display and Adjacent Markets segment offers products for manufacturing liquid crystal displays; organic light-emitting diodes; and other display technologies for TVs, monitors, laptops, personal computers, electronic tablets, smart phones, and other consumer-oriented devices. The company operates in the United States, China, Korea, Taiwan, Japan, Southeast Asia, and Europe. Applied Materials, Inc. was incorporated in 1967 and is headquartered in Santa Clara, California.Show more
  • Revenue$28.37B+4.4%
  • EBITDA$8.4B+1.7%
  • Net Income$7B-2.5%
  • EPS (Diluted)8.66+0.6%
  • Gross Margin48.67%+2.6%
  • EBITDA Margin29.61%-2.6%
  • Operating Margin29.22%+0.9%
  • Net Margin24.67%-6.6%
  • ROE35.51%-12.6%

AMAT Price & Volume

Applied Materials, Inc. (AMAT) stock price & volume — 10-year historical chart

Loading chart...

AMAT Growth Metrics

Applied Materials, Inc. (AMAT) revenue, earnings & EPS growth — 3, 5 & 10-year CAGR

Revenue CAGR

10 Years11.38%
5 Years10.52%
3 Years3.23%
TTM3.33%

Profit CAGR

10 Years17.65%
5 Years14.1%
3 Years2.36%
TTM25.9%

EPS CAGR

10 Years22.7%
5 Years17.18%
3 Years5.19%
TTM29.44%

Return on Capital

10 Years30.59%
5 Years35.06%
3 Years32.78%
Last Year30.56%

AMAT Recent Earnings

Applied Materials, Inc. (AMAT) EPS & revenue vs analyst estimates — last 4 quarters

Full history →
●Beat EPS 12/12 qtrs (100%)●Beat Revenue 11/12 qtrs (92%)
Q2 2026Latest
May 14, 2026
Metric
Actual
Est
EPS
$2.86+6.7%
$2.68
Rev
$7.9B+3.0%
$7.7B
Q1 2026
Feb 12, 2026
Metric
Actual
Est
EPS
$2.38+7.7%
$2.21
Rev
$7.0B+2.1%
$6.9B
Q4 2025
Dec 12, 2025
Metric
Actual
Est
EPS
$2.17+2.8%
$2.11
Rev
$6.8B+1.7%
$6.7B
Q3 2025
Aug 14, 2025
Metric
Actual
Est
EPS
$2.48+5.1%
$2.36
Rev
$7.3B+1.1%
$7.2B
QuarterDateEPS (Act vs Est)Revenue (Act vs Est)
Q2 2026LatestMay 14, 2026
$2.86vs $2.68+6.7%
$7.9Bvs $7.7B+3.0%
Q1 2026Feb 12, 2026
$2.38vs $2.21+7.7%
$7.0Bvs $6.9B+2.1%
Q4 2025Dec 12, 2025
$2.17vs $2.11+2.8%
$6.8Bvs $6.7B+1.7%
Q3 2025Aug 14, 2025
$2.48vs $2.36+5.1%
$7.3Bvs $7.2B+1.1%
Based on last 12 quarters of dataView full earnings history →

Latest AMAT News

Recent stock market news and headlines for Applied Materials, Inc. (AMAT)

Benzinga·13h ago
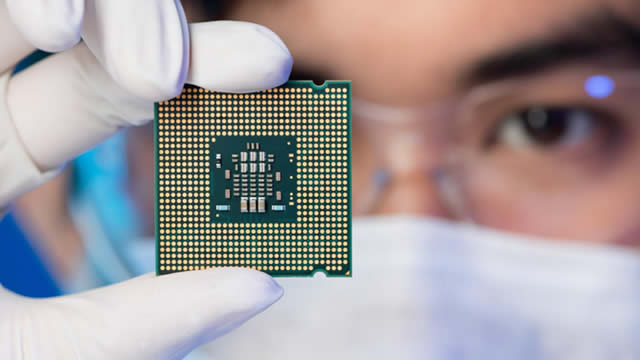
Chip Rout Drags Nasdaq 100 Lower, Oil Climbs: Stock Market Today

A deepening sell-off in chip and memory stocks dragged all four major U.S. equity indexes lower by midday Tuesday.

Zacks Investment Research·14h ago
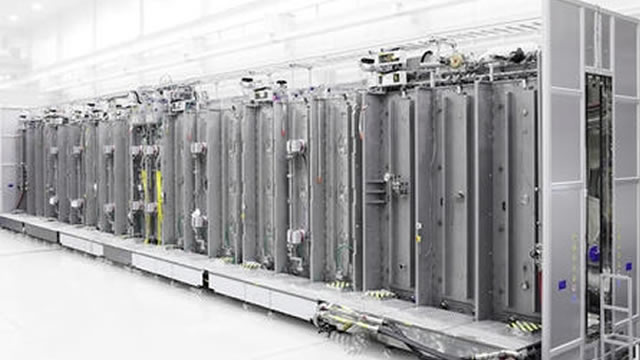
AMAT Stock Rises 284% From Its 52-Week Low: Should You Buy Now?

After a 284% rebound from its 52-week low, Applied Materials still has AI-driven demand, portfolio breadth and earnings momentum supporting further growth.
Zacks Investment Research·15h ago
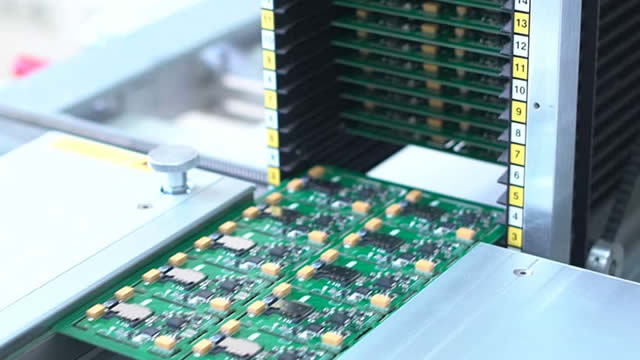
Best Momentum Stock to Buy for July 7th

AMAT, ONTO and BSET made it to the Zacks Rank #1 (Strong Buy) momentum stocks list on July 7, 2026.
24/7 Wall Street·15h ago
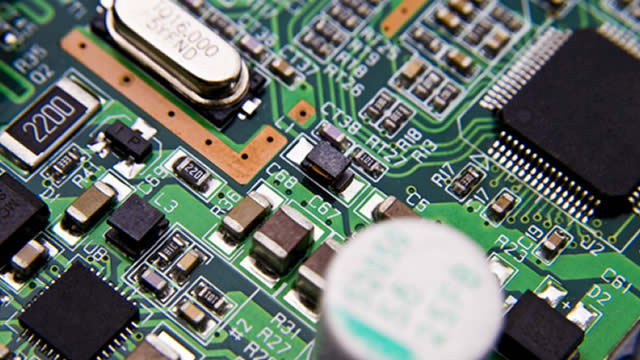
Intel and Applied Materials Dive 10%, AMD Craters 8% as Samsung Earnings Trigger Chip Selloff

Shares of Intel (NASDAQ:INTC | INTC Price Prediction) are down 10% in Tuesday morning trading to $110, while Advanced Micro Devices (NASDAQ:AMD) stock is off 8% to $508.
24/7 Wall Street·1 day ago
The Second-Biggest Stock Sale in History Hits the Nasdaq Friday, and Chip Stocks Are Ripping

SK Hynix, the world's second-largest memory-chip maker, is coming to the NASDAQ on Friday with the largest stock sale anyone has priced in years, and the chip complex is already pricing it in.

Peers Comparison

Key metrics vs top competitors for Applied Materials, Inc. (AMAT)

Full Screener →
CompanyPriceMarket CapP/E RatioRev Growth (1Y)Net MarginROEDiv Yield
AMAT logoAMATApplied Materials, Inc.Current
$554.50$440.25B64.034.39%24.67%35.51%0.31%
LRCX logoLRCXLam Research Corporation
$326.13$407.26B78.5923.68%30.94%65.79%—
KLAC logoKLACKLA Corporation
$216.47$282.77B71.2823.89%35.66%89.07%—
ASML logoASMLASML Holding N.V.
$1747.28$673.43B61.8815.58%29.71%51.95%—
ONTO logoONTOOnto Innovation Inc.
$279.93$13.92B100.691.82%10.33%5.19%—
NVMI logoNVMINova Ltd.
$446.43$14.19B56.0830.96%29.21%21.21%—

Compare AMAT vs Peers

Applied Materials, Inc. (AMAT) vs competitors — business, growth, and fundamentals comparison against the closest industry rivals.

Closest Rival

vs LRCX

Most directly comparable listed peer for AMAT.

Scale Benchmark

vs NVDA

Larger-name benchmark to compare AMAT against a more recognizable public peer.

Peer Set

Compare Top 5

vs LRCX, KLAC, ASML, ONTO

AMAT SEC Filings & Documents

Applied Materials, Inc. (AMAT) SEC filings — annual & quarterly reports (10-K, 10-Q)

8-K Announcements

6
Material company update

May 14, 2026·SEC

Material company update

Mar 13, 2026·SEC

Material company update

Feb 12, 2026·SEC

10-K Annual Reports

3
FY 2025

Dec 12, 2025·SEC

FY 2024

Dec 13, 2024·SEC

FY 2023

Dec 15, 2023·SEC

10-Q Quarterly Reports

6
FY 2026

May 21, 2026·SEC

FY 2026

Feb 19, 2026·SEC

FY 2025

Aug 21, 2025·SEC

Get notified when AMAT posts new earnings or crosses analyst targets

Free. No account needed. Unsubscribe any time.

Free. Unsubscribe any time.

AMAT Frequently Asked Questions

Applied Materials, Inc. (AMAT) stock FAQ — growth, dividends, profitability & financials explained

Growth & Financials
What is Applied Materials, Inc.'s revenue?

Applied Materials, Inc. (AMAT) reported $29.02B in revenue for fiscal year 2025. This represents a 600% increase from $4.14B in 1996.

How fast is Applied Materials, Inc. growing?

Applied Materials, Inc. (AMAT) grew revenue by 4.4% over the past year. Growth has been modest.

Is AMAT profitable?

Yes, Applied Materials, Inc. (AMAT) is profitable, generating $8.51B in net income for fiscal year 2025 (24.7% net margin).

Dividend & Returns
Does AMAT pay dividends?

Yes, Applied Materials, Inc. (AMAT) pays a dividend with a yield of 0.31%. This makes it attractive for income-focused investors.

What is AMAT's return on equity?

Applied Materials, Inc. (AMAT) has a return on equity (ROE) of 35.5%. This is excellent, indicating efficient use of shareholder capital.

What is Applied Materials, Inc.'s free cash flow?

Applied Materials, Inc. (AMAT) generated $5.96B in free cash flow for fiscal year 2025. Positive FCF indicates the company can fund dividends, buybacks, or reinvestment.
What if you invested $1,000 in AMAT back in 1996?

Total return calculator · dividends reinvested · 30+ years of data

See returns →