VCP ScannerFree US Stock Screener & Financial AnalysisFree US Stock Screener
ScreenerThemes
DCF ValuationCalculate intrinsic value of US stocks
Market ValuationBuffett indicator, CAPE & macro gauges
Total ReturnSee dividends + price return history
DCA CalculatorSimulate recurring buys & compounding
Earnings
FAANG & Tech
AAPL vs MSFTNVDA vs AMDGOOGL vs META
Cloud & Cyber
CRM vs NOWCRWD vs PANWSNOW vs DDOG
Consumer & Auto
TSLA vs FAMZN vs WMTNFLX vs DIS
Finance & Crypto
JPM vs BACV vs MACOIN vs MSTR
Pharma & Energy
LLY vs NVOJNJ vs PFEXOM vs CVX
Compare Any Stocks...
WatchlistInsider
ScreenerThemes
Earnings
WatchlistInsider
UTZ
← Back to Screener
VCP ScannerFree US Stock Screener & Financial Analysis

Find stocks. Verify deeply. Act with conviction.

Data updated daily

Product

  • Screener
  • Themes
  • Valuation
  • Total Return
  • DCA Calculator
  • News
  • Earnings

Resources

  • Market Valuation
  • Compare
  • Insider Activity
  • Methodology
  • How It Works
  • Glossary
  • Learn

Get Ideas

Get weekly stock ideas — free

© 2026 VCP Scanner
AboutPrivacyTerms
Not financial advice. Do your own research.
ScreenerNewsCompareWatchlist
UTZUtz Brands, Inc.
$8.16$722M
Overview & Verdict
Overview
Valuation & Forecasts
Valuation ModelsEstimatesDCF Model
Price & Analyst Data
Analyst TargetsPrice HistoryTechnical Analysis
Financial Statements
Income StatementBalance SheetCash FlowRatios & Margins
Performance
P/E HistoryRevenue HistoryEarnings HistoryDividend HistoryTotal Return
Ownership
Holders

UTZ logoUtz Brands, Inc.(UTZ)Earnings, Financials & Key Ratios

UTZ•NYSE
$8.16
896.7× P/E·Price updated Jul 7, 2026
SectorConsumer DefensiveIndustryPackaged FoodsSub-IndustrySnacks and bakery products
AboutUtz Brands, Inc. operates as a snack food manufacturing company. It offers a range of salty snacks, including potato chips, kettle chips, tortilla chips, pretzels, cheese snacks, veggie snacks, pork skins, pub/party mixes, salsa and queso, ready-to-eat popcorn, and other snacks under the Utz, Zapp's, ON THE BORDER, Golden Flake, Good Health, Boulder Canyon, Hawaiian, TGIF, TORTIYAHS!, and other brand names. The company distributes its products to grocery, mass, club, convenience, drug, and other retailers though direct shipments, distributors, and direct store delivery routes. Utz Brands, Inc. was founded in 1921 and is headquartered in Hanover, Pennsylvania.Show more

  • Revenue$1.44B+2.1%
  • EBITDA$181M+39.3%
  • Net Income$800K-95.0%
  • EPS (Diluted)0.01-95.2%
  • Gross Margin22.39%-36.2%
  • EBITDA Margin12.57%+36.5%
  • Operating Margin6.85%+63.8%
  • Net Margin0.06%-95.1%
  • ROE0.06%-94.9%

UTZ Price & Volume

Utz Brands, Inc. (UTZ) stock price & volume — 10-year historical chart

Loading chart...

Operational Volatility Challenges Utz Brands Growth Strategy

Investment Thesis • Updated 2026Q1

VerdictNeutral
Growth:Mixed
Profitability:Strained
Financial:Strained
Cash Flow:Mixed
Primary Risk:Margin compression and integration

Key Thesis Takeaways

  • Utz Brands faces a complex transition as it attempts to scale its national footprint while grappling with significant margin instability and erratic cash flow generation.
  • While the company has achieved a dramatic reduction in total debt to $49.5 million as of 2026Q1, the persistent negative retained earnings of $334.4 million and reliance on goodwill for 30.9% of total assets suggest ongoing integration risks.
  • Investors should monitor whether the company can achieve consistent operating leverage, as current margins remain thin at 1.8% and continue to be pressured by high capital intensity.

Verdict Logic

while the rapid deleveraging to $49.5 million in debt is notable, the company's inability to maintain consistent profitability, evidenced by a -0.5% net margin in 2026Q1, warrants a cautious wait-and-see approach.

UTZ Growth Metrics

Utz Brands, Inc. (UTZ) revenue, earnings & EPS growth — 3, 5 & 10-year CAGR

Revenue CAGR

10 Years-
5 Years8.33%
3 Years0.71%
TTM2.34%

Profit CAGR

10 Years-
5 Years-
3 Years-
TTM-130.58%

EPS CAGR

10 Years-
5 Years-
3 Years-
TTM-130.98%

Return on Capital

10 Years2.63%
5 Years1.53%
3 Years2.34%
Last Year4.01%

UTZ Recent Earnings

Utz Brands, Inc. (UTZ) EPS & revenue vs analyst estimates — last 4 quarters

Full history →
●Beat EPS 5/12 qtrs (42%)●Beat Revenue 4/12 qtrs (33%)
Q2 2026Latest
May 6, 2026
Metric
Actual
Est
EPS
$0.15+7.1%
$0.14
Rev
$361M-0.1%
$362M
Q1 2026
Feb 12, 2026
Metric
Actual
Est
EPS
$0.26+0.0%
$0.26
Rev
$342M-0.4%
$343M
Q4 2025
Oct 30, 2025
Metric
Actual
Est
EPS
$0.23+0.0%
$0.23
Rev
$378M+7.6%
$351M
Q3 2025
Jul 31, 2025
Metric
Actual
Est
EPS
$0.17-10.5%
$0.19
Rev
$367M-2.3%
$375M
QuarterDateEPS (Act vs Est)Revenue (Act vs Est)
Q2 2026LatestMay 6, 2026
$0.15vs $0.14+7.1%
$361Mvs $362M-0.1%
Q1 2026Feb 12, 2026
$0.26vs $0.26+0.0%
$342Mvs $343M-0.4%
Q4 2025Oct 30, 2025
$0.23vs $0.23+0.0%
$378Mvs $351M+7.6%
Q3 2025Jul 31, 2025
$0.17vs $0.19-10.5%
$367Mvs $375M-2.3%
Based on last 12 quarters of dataView full earnings history →

Latest UTZ News

Recent stock market news and headlines for Utz Brands, Inc. (UTZ)

Zacks Investment Research·Jun 29, 2026
Strength Seen in Utz Brands (UTZ): Can Its 6.8% Jump Turn into More Strength?

Utz Brands (UTZ) witnessed a jump in share price last session on above-average trading volume. The latest trend in earnings estimate revisions for the stock doesn't suggest further strength down the road.

Business Wire·Jun 22, 2026
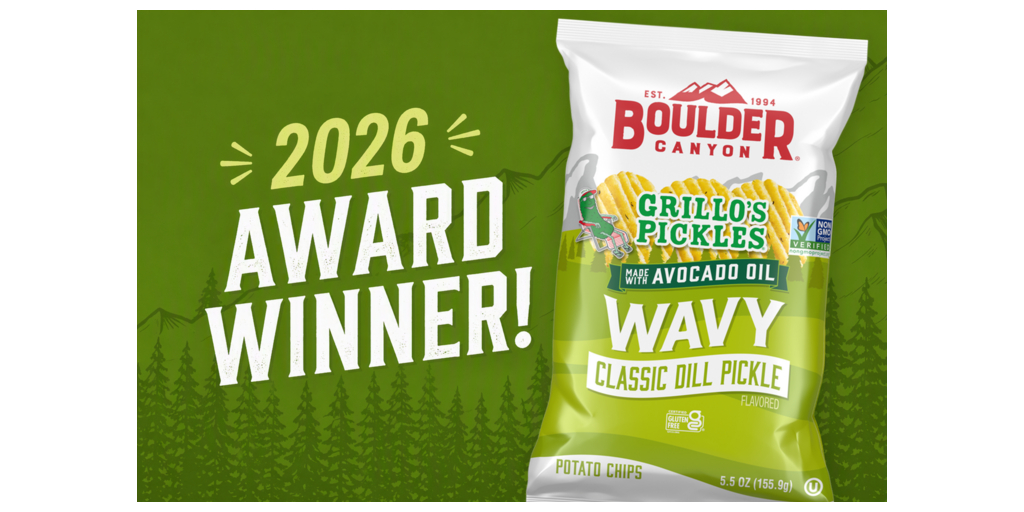
Boulder Canyon's Wavy Grillo's Classic Dill Pickle Flavored Chips Selected as a Good Housekeeping 2026 Snack Awards Winner

HANOVER, Pa.--(BUSINESS WIRE)--Boulder Canyon®, a pioneer in better-for-you snacking, announced today that its Wavy Grillo's Classic Dill Pickle Flavored Chips have been named a winner in Good Housekeeping's 2026 Snack Awards. The complete list of award winners can be found on the Good Housekeeping website. This product stands out for its partnership with beloved brand Grillo's Pickles® and ingredient-driven flavor. Inspired by Grillo's iconic pickles, the potato chips pair bold dill pickle fla.

GuruFocus·Jun 15, 2026
America's Snacking Season Is Here: New National Survey Reveals Americans Don't Stop Snacking All Summer Long

Summer is America's peak snacking season, according to a new nationally representative survey from Utz Brands, Inc., a leading U.S. manufacturer of branded sal

Business Wire·Jun 15, 2026
America's Snacking Season Is Here: New National Survey Reveals Americans Don't Stop Snacking All Summer Long

HANOVER, Pa.--(BUSINESS WIRE)--Summer is America's peak snacking season, according to a new nationally representative survey from Utz Brands, Inc., a leading U.S. manufacturer of branded salty snacks, conducted by independent pollsters Censuswide.* The findings reveal that nearly two-thirds of Americans (62.2%) snack at least once every day during the summer months and 30.5% reach for something salty multiple times a day. Just 1% report never snacking in summer, making it one of the most univer.

Peers Comparison

Key metrics vs top competitors for Utz Brands, Inc. (UTZ)

Full Screener →
CompanyPriceMarket CapP/E RatioRev Growth (1Y)Net MarginROEDiv Yield
UTZ logoUTZUtz Brands, Inc.Current
$8.16$721.61M896.702.09%0.06%0.06%3.11%
SMPL logoSMPLThe Simply Good Foods Company
$13.17$1.19B12.918.98%-7.46%-6.15%—
HAIN logoHAINThe Hain Celestial Group, Inc.
$0.59$53.66M-0.10-10.17%-35.47%-140.7%—
PEP logoPEPPepsiCo, Inc.
$144.98$198.18B24.162.25%9.16%43.62%—
MDLZ logoMDLZMondelez International, Inc.
$60.22$77.3B31.865.75%6.65%10.03%—
CPB logoCPBCampbell Soup Company
$22.90$6.83B11.396.4%6.12%15.3%—

Compare UTZ vs Peers

Utz Brands, Inc. (UTZ) vs competitors — business, growth, and fundamentals comparison against the closest industry rivals.

Closest Rival

vs SMPL

Most directly comparable listed peer for UTZ.

Scale Benchmark

vs PEP

Larger-name benchmark to compare UTZ against a more recognizable public peer.

Peer Set

Compare Top 5

vs SMPL, HAIN, PEP, MDLZ

UTZ SEC Filings & Documents

Utz Brands, Inc. (UTZ) SEC filings — annual & quarterly reports (10-K, 10-Q)

8-K Announcements

6
Material company update

May 6, 2026·SEC

Material company update

Apr 27, 2026·SEC

Material company update

Feb 18, 2026·SEC

10-K Annual Reports

3
FY 2026

Feb 12, 2026·SEC

FY 2025

Feb 20, 2025·SEC

FY 2024

Feb 29, 2024·SEC

10-Q Quarterly Reports

6
FY 2026

May 6, 2026·SEC

FY 2025

Oct 30, 2025·SEC

FY 2025

Jul 31, 2025·SEC

Get notified when UTZ posts new earnings or crosses analyst targets

Free. No account needed. Unsubscribe any time.

Free. Unsubscribe any time.

UTZ Frequently Asked Questions

Utz Brands, Inc. (UTZ) stock FAQ — growth, dividends, profitability & financials explained

Growth & Financials
What is Utz Brands, Inc.'s revenue?

Utz Brands, Inc. (UTZ) reported $1.45B in revenue for fiscal year 2025. This represents a 88% increase from $772.0M in 2018.

How fast is Utz Brands, Inc. growing?

Utz Brands, Inc. (UTZ) grew revenue by 2.1% over the past year. Growth has been modest.

Is UTZ profitable?

Utz Brands, Inc. (UTZ) reported a net loss of $8.4M for fiscal year 2025.

Dividend & Returns
Does UTZ pay dividends?

Yes, Utz Brands, Inc. (UTZ) pays a dividend with a yield of 3.11%. This makes it attractive for income-focused investors.

What is UTZ's return on equity?

Utz Brands, Inc. (UTZ) has a return on equity (ROE) of 0.1%. This is below average, suggesting room for improvement.

What is Utz Brands, Inc.'s free cash flow?

Utz Brands, Inc. (UTZ) generated $42.4M in free cash flow for fiscal year 2025. Positive FCF indicates the company can fund dividends, buybacks, or reinvestment.

What if you invested $1,000 in UTZ back in 2018?

Total return calculator · dividends reinvested · 8+ years of data

See returns →