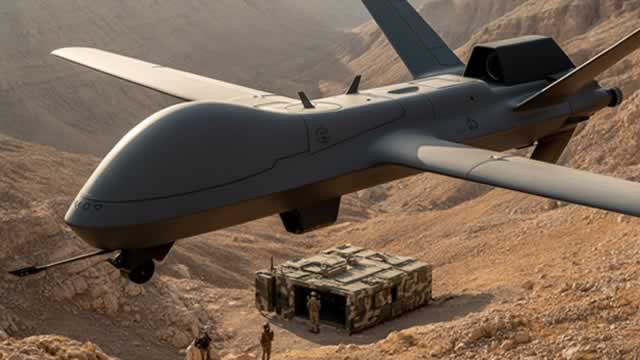
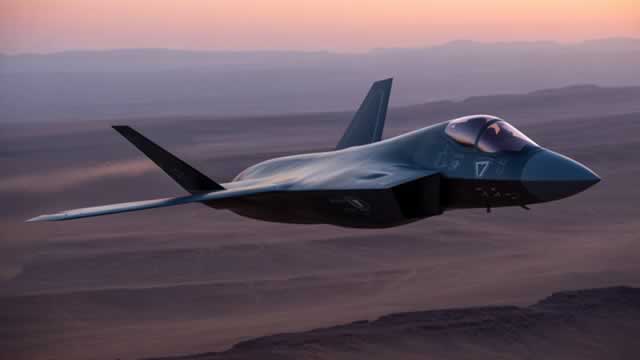
TXT strengthens its helicopter market position as Bell delivers a 407GXi to Texas DPS, highlighting demand for advanced rotorcraft and mission-ready capabilities.

Textron Inc. (TXT) stock price & volume — 10-year historical chart
Investment Thesis • Updated 2026Q1
while the forward P/E of 14.00 suggests potential value, the extreme volatility in cash generation and the recent negative 6.8% free cash flow margin indicate significant execution risks.
Textron Inc. (TXT) revenue, earnings & EPS growth — 3, 5 & 10-year CAGR
Textron Inc. (TXT) EPS & revenue vs analyst estimates — last 4 quarters
| Quarter | Date | EPS (Act vs Est) | Revenue (Act vs Est) |
|---|---|---|---|
| Q2 2026Latest | Apr 30, 2026 | $1.45vs $1.30+11.5% | $3.7Bvs $3.5B+5.5% |
| Q1 2026 | Jan 28, 2026 | $1.73vs $1.70+1.8% | $4.2Bvs $4.0B+3.2% |
| Q4 2025 | Oct 23, 2025 | $1.55vs $1.46+6.2% | $3.6Bvs $3.7B-2.7% |
| Q3 2025 | Jul 24, 2025 | $1.55vs $1.45+6.9% | $3.5Bvs $3.6B-3.1% |
Recent stock market news and headlines for Textron Inc. (TXT)
TXT strengthens its helicopter market position as Bell delivers a 407GXi to Texas DPS, highlighting demand for advanced rotorcraft and mission-ready capabilities.

The Zacks Style Scores offers investors a way to easily find top-rated stocks based on their investing style. Here's why you should take advantage.

PROVIDENCE, R.I.--(BUSINESS WIRE)--Textron Inc. (NYSE: TXT) will release its second quarter 2026 financial results on Tuesday morning, July 28, 2026. Textron will also host a conference call at 8:00 a.m. (Eastern) to discuss the results and the company's outlook. The call will be available via webcast at www.textron.com or by direct dial at (888) 596-4144 in the U.S. or (646) 968-2525 outside of the U.S.; Access Code: 6969175. In addition, the call will be recorded and available for playback be.

GE's commercial and defense momentum, investments and shareholder returns compete with TXT's growth and valuation story.

TXT's business jet demand, defense programs and product upgrades support growth, even as supply-chain issues and labor shortages weigh.

Key metrics vs top competitors for Textron Inc. (TXT)
| Company | Price | Market Cap | P/E Ratio | Rev Growth (1Y) | Net Margin | ROE | Div Yield |
|---|---|---|---|---|---|---|---|
| $91.58 | $15.94B | 17.92 | 8.01% | 6.22% | 12.22% | 0.12% | |
| $374.64 | $101.31B | 24.23 | 10.13% | 8.07% | 17.41% | — | |
| $295.40 | $55.18B | 34.63 | 2.53% | 7.71% | 8.87% | — | |
| $289.46 | $11.4B | 18.81 | 8.23% | 4.71% | 12.05% | — | |
| $549.04 | $77.98B | 18.88 | 2.24% | 10.8% | 28.05% | — | |
| $535.38 | $123.38B | 24.91 | 5.65% | 6.38% | 74.53% | — |
Textron Inc. (TXT) vs competitors — business, growth, and fundamentals comparison against the closest industry rivals.
Textron Inc. (TXT) SEC filings — annual & quarterly reports (10-K, 10-Q)
May 1, 2026·SEC
Apr 30, 2026·SEC
Feb 2, 2026·SEC
Get notified when TXT posts new earnings or crosses analyst targets
Free. No account needed. Unsubscribe any time.
Textron Inc. (TXT) stock FAQ — growth, dividends, profitability & financials explained
Textron Inc. (TXT) reported $15.19B in revenue for fiscal year 2025. This represents a 102% increase from $7.51B in 1996.
Textron Inc. (TXT) grew revenue by 8.0% over the past year. This is steady growth.
Yes, Textron Inc. (TXT) is profitable, generating $934.0M in net income for fiscal year 2025 (6.2% net margin).
Yes, Textron Inc. (TXT) pays a dividend with a yield of 0.12%. This makes it attractive for income-focused investors.
Textron Inc. (TXT) has a return on equity (ROE) of 12.2%. This is reasonable for most industries.
Textron Inc. (TXT) generated $707.0M in free cash flow for fiscal year 2025. Positive FCF indicates the company can fund dividends, buybacks, or reinvestment.