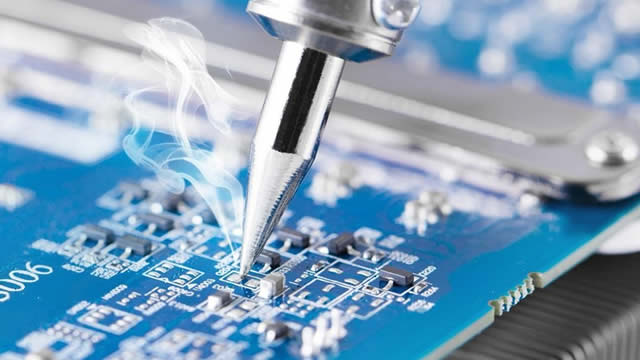
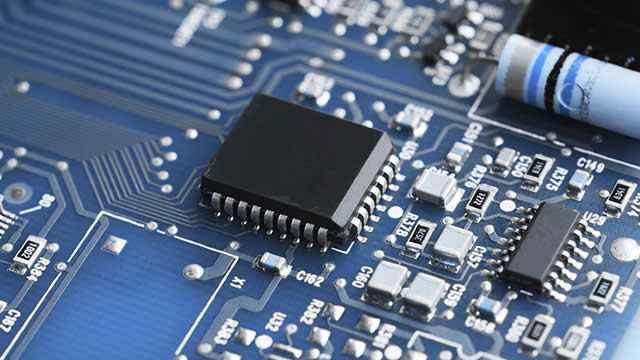
AboutTrio-Tech International, together with its subsidiaries, provides manufacturing, testing, and distribution services to the semiconductor industry. The company's Testing Services segment offers stabilization bake, thermal shock, temperature cycling, mechanical shock, constant acceleration, gross and fine leak, electrical, static and dynamic burn-in, and vibration testing, as well as reliability lab and microprocessor equipment contract cleaning services. This segment also provides qualification testing services that test small samples of output from manufacturers for qualification of their processes and devices. Its Manufacturing segment manufactures front-end semiconductor test equipment, such as artic temperature-controlled wafer chucks used for test, characterization, and failure analysis of semiconductor wafers and other components; and wet process stations for cleaning, rinsing, and drying semiconductor wafers, flat panel display magnetic disks, and other microelectronic substrates. This segment also manufactures back-end products comprising autoclaves and highly accelerated stress test equipment; burn-in equipment and boards; and component centrifuges and leak detection equipment. The company's Distribution segment distributes complementary products, including environmental chambers, handlers, interface systems, vibration systems, shaker systems, solderability testers, and other semiconductor equipment, as well as components, such as connectors, sockets, LCD display panels, and touch-screen panels. Its Real Estate segment invests in and rents real estate properties. The company primarily serves semiconductor chip manufacturers or testing facilities that purchase testing equipment. The company operates in the United States, Singapore, Malaysia, Thailand, and China. Trio-Tech International was incorporated in 1958 and is headquartered in Van Nuys, California.Show more