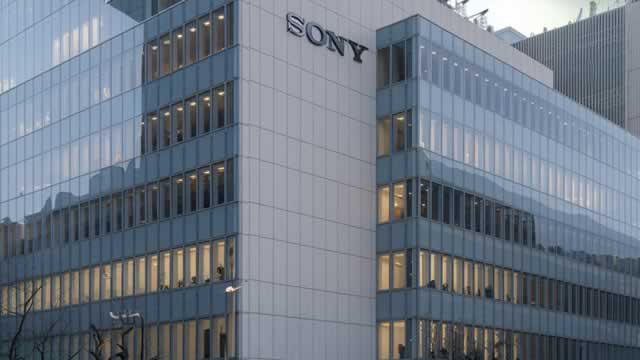
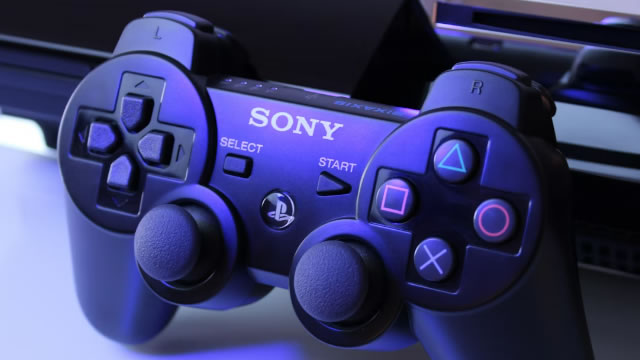
AboutSony Group Corporation designs, develops, produces, and sells electronic equipment, instruments, and devices for the consumer, professional, and industrial markets in Japan, the United States, Europe, China, the Asia-Pacific, and internationally. The company distributes software titles and add-on content through digital networks; network services related to game, video, and music content; and home and portable game consoles, packaged software, and peripheral devices. It also develops, produces, markets, and distributes recorded music; publishes music; and produces and distributes animation titles, game applications, and various services for music and visual products. In addition, the company produces, acquires, and distributes live-action and animated motion pictures for theatrical release, as well as scripted and animated series, unscripted reality or light entertainment, daytime serials, game shows, television movies, and miniseries and other television programs; operates a visual effects and animation unit; manages a studio facility; and operates television and digital networks, and post-production facilities. Further, it researches, develops, designs, produces, markets, distributes, sells, and services televisions, and video and sound products; interchangeable lens, compact digital, and consumer and professional video cameras; projectors and medical equipment; mobile phones, tablets, accessories, and applications; and metal oxide semiconductor image sensors, charge-coupled devices, integration systems, and other semiconductors. Additionally, it offers Internet broadband network services; recording media, and storage media products; and life and non-life insurance, banking, and other services, as well as creates and distributes content for PCs and mobile phones. The company was formerly known as Sony Corporation and changed its name to Sony Group Corporation in April 2021. Sony Group Corporation was incorporated in 1946 and is headquartered in Tokyo, Japan.Show more