NuScale Power stock has plummeted since hitting a high in mid-October 2025. If the stock grew 100-fold, a $10,000 investment at today's price could become $1 million.


NuScale Power Corporation (SMR) stock price & volume — 10-year historical chart
Investment Thesis • Updated 2026Q1
the company's fundamental outlook is constrained by a massive $533.1 million free cash flow deficit in 2026Q1 and the absence of a predictable, utility-style revenue stream.
NuScale Power Corporation (SMR) revenue, earnings & EPS growth — 3, 5 & 10-year CAGR
NuScale Power Corporation (SMR) EPS & revenue vs analyst estimates — last 4 quarters
| Quarter | Date | EPS (Act vs Est) | Revenue (Act vs Est) |
|---|---|---|---|
| Q2 2026Latest | May 7, 2026 | $0.14vs $0.11-27.3% | $565,000vs $7M-91.9% |
| Q1 2026 | Feb 26, 2026 | $0.80vs $0.10-700.0% | $2Mvs $9M-79.0% |
| Q4 2025 | Nov 6, 2025 | $1.85vs $0.14-1225.0% | $8Mvs $11M-25.5% |
| Q3 2025 | Aug 7, 2025 | $0.13vs $0.12-8.3% | $8Mvs $12M-30.9% |
Recent stock market news and headlines for NuScale Power Corporation (SMR)
NuScale Power stock has plummeted since hitting a high in mid-October 2025. If the stock grew 100-fold, a $10,000 investment at today's price could become $1 million.
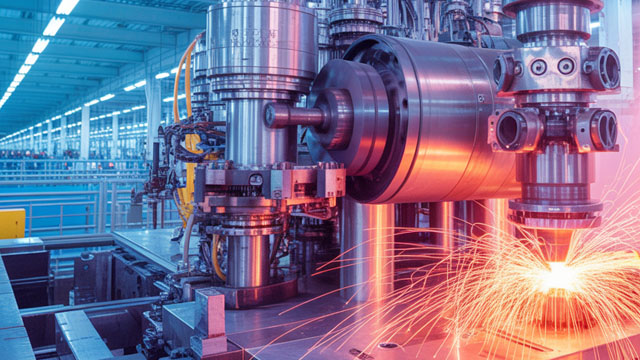
NuScale Power's ENTRA1 partnership aims to turn approved SMR technology into financed commercial plants for power, hydrogen, desalination and heat.

NuScale Power has a significant opportunity ahead. The company still needs to prove its product and business model are viable.

Nuclear energy is experiencing renewed global interest. NuScale Power may be accepted as a major nuclear player by year's end.

NuScale's stock has plunged more than 80% from its record high. But its revenue could skyrocket in the 2030s once its first reactors come online.

Key metrics vs top competitors for NuScale Power Corporation (SMR)
| Company | Price | Market Cap | P/E Ratio | Rev Growth (1Y) | Net Margin | ROE | Div Yield |
|---|---|---|---|---|---|---|---|
| $8.96 | $1.2B | -4.13 | -15.02% | -1130.26% | -45.42% | — | |
| $47.90 | $8.33B | -66.53 | — | — | -8.57% | — | |
| $12.86 | $3.21B | -34.76 | -15.61% | -82.7% | -10.16% | — | |
| $18.88 | $784.87M | -17.81 | — | — | -7.62% | — | |
| $186.08 | $17.05B | 51.83 | 18.3% | 10.21% | 27.91% | — | |
| $165.64 | $3.14B | 42.47 | 1.52% | 13.4% | 10.71% | — |
NuScale Power Corporation (SMR) vs competitors — business, growth, and fundamentals comparison against the closest industry rivals.
NuScale Power Corporation (SMR) SEC filings — annual & quarterly reports (10-K, 10-Q)
May 7, 2026·SEC
Apr 8, 2026·SEC
Feb 26, 2026·SEC
Get notified when SMR posts new earnings or crosses analyst targets
Free. No account needed. Unsubscribe any time.
NuScale Power Corporation (SMR) stock FAQ — growth, dividends, profitability & financials explained
NuScale Power Corporation (SMR) reported $18.7M in revenue for fiscal year 2025. This represents a 4905% increase from $0.4M in 2019.
NuScale Power Corporation (SMR) saw revenue decline by 15.0% over the past year.
NuScale Power Corporation (SMR) reported a net loss of $385.8M for fiscal year 2025.
NuScale Power Corporation (SMR) has a return on equity (ROE) of -45.4%. Negative ROE indicates the company is unprofitable.
NuScale Power Corporation (SMR) had negative free cash flow of $1.39B in fiscal year 2025, likely due to heavy capital investments.