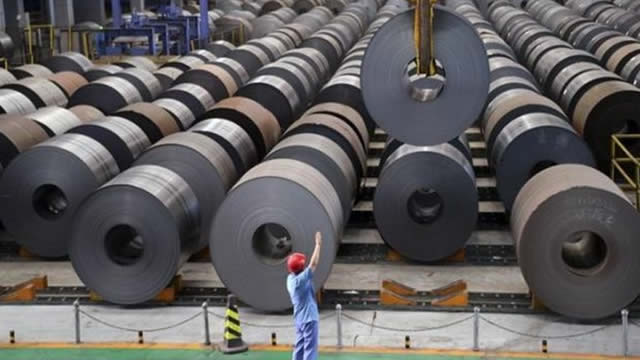
RS shares are up 33.5% year to date on record Q1 shipment volumes, extending its streak of industry outperformance as infrastructure demand and acquisitions support growth.
Reliance Steel & Aluminum Co. (RS) stock price & volume — 10-year historical chart
Investment Thesis • Updated 2026Q1
while the company exhibits strong operational resilience and a 15.5% revenue growth rate, the current P/E of 27.60 and high sensitivity to working capital cycles warrant caution regarding valuation entry points.
Reliance Steel & Aluminum Co. (RS) revenue, earnings & EPS growth — 3, 5 & 10-year CAGR
Reliance Steel & Aluminum Co. (RS) EPS & revenue vs analyst estimates — last 4 quarters
| Quarter | Date | EPS (Act vs Est) | Revenue (Act vs Est) |
|---|---|---|---|
| Q2 2026Latest | Apr 22, 2026 | $5.16vs $4.63+11.4% | $4.0Bvs $3.9B+3.5% |
| Q1 2026 | Feb 18, 2026 | $2.40vs $2.83-15.2% | $3.5Bvs $3.4B+1.5% |
| Q4 2025 | Oct 22, 2025 | $3.64vs $3.68-1.1% | $3.7Bvs $3.4B+6.0% |
| Q3 2025 | Jul 23, 2025 | $4.43vs $4.68-5.3% | $3.7Bvs $3.7B+0.0% |
Recent stock market news and headlines for Reliance Steel & Aluminum Co. (RS)
RS shares are up 33.5% year to date on record Q1 shipment volumes, extending its streak of industry outperformance as infrastructure demand and acquisitions support growth.
On June 26, 2026, Reliance Inc (RS) shares fell 4.9% to a current price of $385.78. This decline comes amid a 52-week trading range of $260.31 to $419.83, refle

TORONTO, June 23, 2026 (GLOBE NEWSWIRE) -- Real Estate Split Corp. (TSX: RS and RS.PR.A) is pleased to announce that a distribution for June 2026 will be payable to Class A shareholders as follows:

RS sees healthy demand and higher pricing ahead as acquisitions and infrastructure-driven markets continue to support growth.

Key metrics vs top competitors for Reliance Steel & Aluminum Co. (RS)
| Company | Price | Market Cap | P/E Ratio | Rev Growth (1Y) | Net Margin | ROE | Div Yield |
|---|---|---|---|---|---|---|---|
| $379.35 | $19.39B | 27.14 | 3.32% | 5.17% | 10.26% | 1.27% | |
| $192.11 | $7.95B | 23.31 | 4.51% | 14.92% | 16.86% | — | |
| $221.76 | $31.98B | 27.75 | 3.63% | 7.22% | 15.29% | — | |
| $61.58 | $6.81B | 83.22 | -1.61% | 6.72% | 13.65% | — | |
| $47.86 | $532.97M | 24.29 | -10.03% | 0.73% | 2.39% | — | |
| $120.07 | $6.71B | 33.63 | -1.35% | 5.9% | 16.51% | — |
Reliance Steel & Aluminum Co. (RS) vs competitors — business, growth, and fundamentals comparison against the closest industry rivals.
Reliance Steel & Aluminum Co. (RS) SEC filings — annual & quarterly reports (10-K, 10-Q)
Apr 22, 2026·SEC
Feb 18, 2026·SEC
Oct 22, 2025·SEC
Get notified when RS posts new earnings or crosses analyst targets
Free. No account needed. Unsubscribe any time.
Reliance Steel & Aluminum Co. (RS) stock FAQ — growth, dividends, profitability & financials explained
Reliance Steel & Aluminum Co. (RS) reported $14.84B in revenue for fiscal year 2025. This represents a 2168% increase from $654.0M in 1996.
Reliance Steel & Aluminum Co. (RS) grew revenue by 3.3% over the past year. Growth has been modest.
Yes, Reliance Steel & Aluminum Co. (RS) is profitable, generating $806.0M in net income for fiscal year 2025 (5.2% net margin).
Yes, Reliance Steel & Aluminum Co. (RS) pays a dividend with a yield of 1.27%. This makes it attractive for income-focused investors.
Reliance Steel & Aluminum Co. (RS) has a return on equity (ROE) of 10.3%. This is reasonable for most industries.
Reliance Steel & Aluminum Co. (RS) generated $612.1M in free cash flow for fiscal year 2025. Positive FCF indicates the company can fund dividends, buybacks, or reinvestment.