Zacks Investment Research·6 days ago
Oneok Inc. (OKE) Suffers a Larger Drop Than the General Market: Key InsightsThe latest trading day saw Oneok Inc. (OKE) settling at $85.73, representing a -1.39% change from its previous close.
 ONEOK, Inc.(OKE)Earnings, Financials & Key Ratios
ONEOK, Inc. (OKE) stock price & volume — 10-year historical chart
Investment Thesis • Updated 2026Q1
while the company shows a low PEG ratio of 0.54, the combination of a 0.71 current ratio and a 1.50 debt-to-equity ratio warrants caution regarding the company's ability to sustain shareholder returns amid ongoing capital intensity.
ONEOK, Inc. (OKE) revenue, earnings & EPS growth — 3, 5 & 10-year CAGR
ONEOK, Inc. (OKE) EPS & revenue vs analyst estimates — last 4 quarters
| Quarter | Date | EPS (Act vs Est) | Revenue (Act vs Est) |
|---|---|---|---|
| Q2 2026Latest | Apr 28, 2026 | $1.23vs $1.30-5.4% | $9.6Bvs $8.2B+16.8% |
| Q1 2026 | Feb 23, 2026 | $1.55vs $1.50+3.3% | $9.1Bvs $8.7B+3.6% |
| Q4 2025 | Oct 28, 2025 | $1.49vs $1.44+3.5% | $8.6Bvs $8.8B-1.7% |
| Q3 2025 | Aug 4, 2025 | $1.34vs $1.33+0.8% | $7.9Bvs $7.7B+2.6% |
Recent stock market news and headlines for ONEOK, Inc. (OKE)
The latest trading day saw Oneok Inc. (OKE) settling at $85.73, representing a -1.39% change from its previous close.
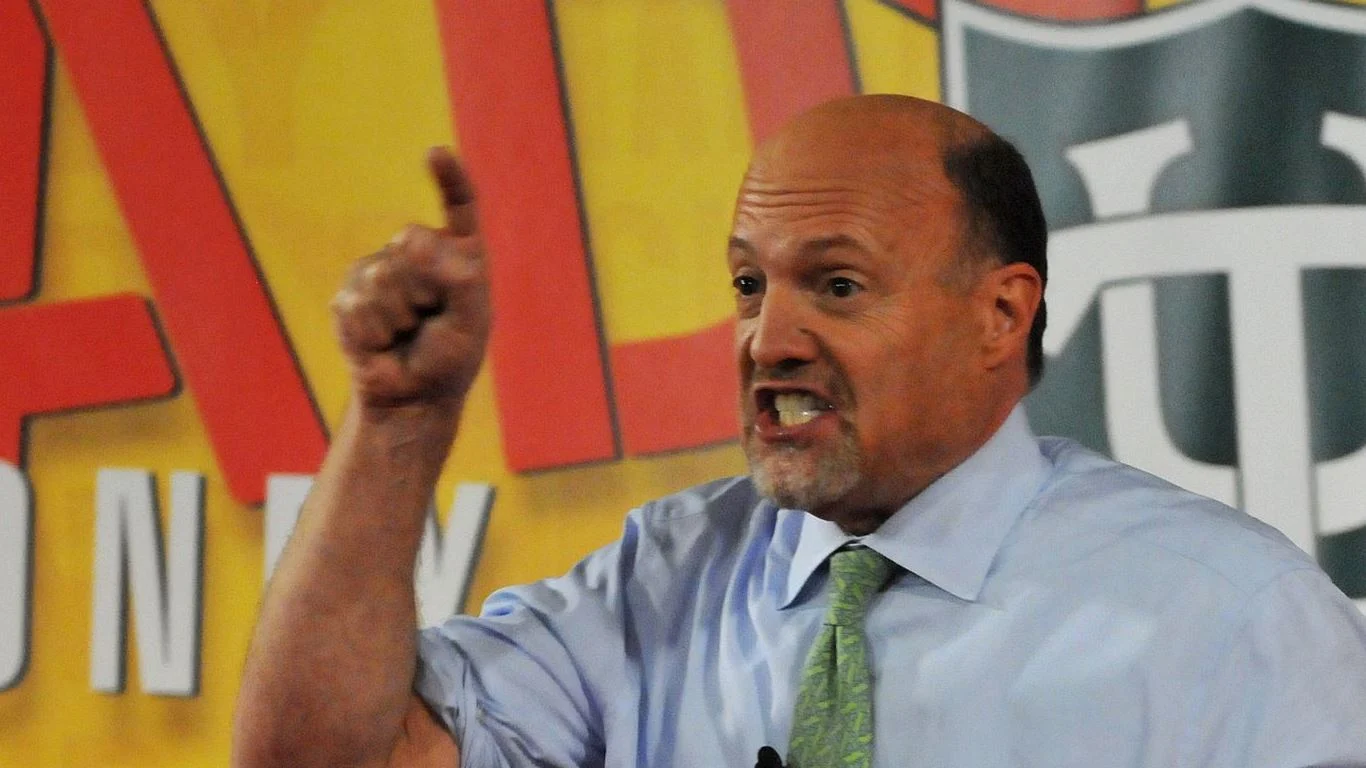
A caller on the June 29 episode of Mad Money laid out the trade that has been eating at retail investors for two years. "If I can get a guaranteed interest rate of over 5% by purchasing a 6-month Treasury bond, why should I invest in the equities market given market conditions?" Jim Cramer did... Why Buy Stocks When T-Bills Pay 5%? Jim Cramer's Blunt Answer
Smart investors know the best time to zig is when everyone else is zagging.

The energy infrastructure sector includes a range of different business models, from gathering systems at the wellhead to long-haul pipelines and export facilities. Comparing midstream companies without a standardized framework of midstream classifications can be difficult.

The reopening of the Strait of Hormuz continues to face obstacles.

Key metrics vs top competitors for ONEOK, Inc. (OKE)
| Company | Price | Market Cap | P/E Ratio | Rev Growth (1Y) | Net Margin | ROE | Div Yield |
|---|---|---|---|---|---|---|---|
| $90.67 | $57.12B | 16.73 | 55.42% | 10.1% | 15.19% | 4.51% | |
| $75.08 | $91.82B | 35.08 | 13.78% | 23.82% | 18.98% | — | |
| $32.49 | $72.28B | 23.72 | 12.45% | 18.92% | 10.27% | — | |
| $273.81 | $58.77B | 32.14 | 3.06% | 12.98% | 70.77% | — | |
| $146.13 | $14.91B | 32.99 | 26.71% | 36.6% | 9.61% | — | |
| $57.51 | $58.38B | 11.93 | 8.37% | 37.54% | 32.81% | — |
ONEOK, Inc. (OKE) vs competitors — business, growth, and fundamentals comparison against the closest industry rivals.
ONEOK, Inc. (OKE) SEC filings — annual & quarterly reports (10-K, 10-Q)
Apr 28, 2026·SEC
Mar 25, 2026·SEC
Feb 23, 2026·SEC
Get notified when OKE posts new earnings or crosses analyst targets
Free. No account needed. Unsubscribe any time.
ONEOK, Inc. (OKE) stock FAQ — growth, dividends, profitability & financials explained
ONEOK, Inc. (OKE) reported $35.20B in revenue for fiscal year 2025. This represents a 2775% increase from $1.22B in 1996.
ONEOK, Inc. (OKE) grew revenue by 55.4% over the past year. This is strong growth.
Yes, ONEOK, Inc. (OKE) is profitable, generating $3.53B in net income for fiscal year 2025 (10.1% net margin).
Yes, ONEOK, Inc. (OKE) pays a dividend with a yield of 4.51%. This makes it attractive for income-focused investors.
ONEOK, Inc. (OKE) has a return on equity (ROE) of 15.2%. This is reasonable for most industries.
ONEOK, Inc. (OKE) generated $2.24B in free cash flow for fiscal year 2025. Positive FCF indicates the company can fund dividends, buybacks, or reinvestment.