Barrons·Jun 26, 2026
Home Builder Stocks Are Showing Newfound Strength. Why a 30% Gain Is Possible.Technical analysis indicates a home builder ETF could climb nearly 30% by the end of the year.
 KB Home(KBH)Earnings, Financials & Key Ratios
KB Home (KBH) stock price & volume — 10-year historical chart
Investment Thesis • Updated 2026Q1
the company's 65.1% year-over-year EPS decline in 2026Q1 and negative free cash flow trajectory suggest that current valuation multiples may not fully account for ongoing margin compression.
KB Home (KBH) revenue, earnings & EPS growth — 3, 5 & 10-year CAGR
KB Home (KBH) EPS & revenue vs analyst estimates — last 4 quarters
| Quarter | Date | EPS (Act vs Est) | Revenue (Act vs Est) |
|---|---|---|---|
| Q3 2026Latest | Jun 23, 2026 | $0.43vs $0.44-2.3% | $1.1Bvs $1.1B+2.1% |
| Q2 2026 | Mar 24, 2026 | $0.52vs $0.52+0.0% | $1.1Bvs $1.1B-1.4% |
| Q1 2026 | Jan 12, 2026 | $2.52vs $1.79+40.8% | $1.7Bvs $1.7B+1.9% |
| Q4 2025 | Sep 24, 2025 | $1.61vs $1.50+7.3% | $1.6Bvs $1.6B+1.8% |
Recent stock market news and headlines for KB Home (KBH)
Technical analysis indicates a home builder ETF could climb nearly 30% by the end of the year.
Persistently high mortgage rates continue to weigh on the U.S. housing industry. KB Home has a smart strategy to limit risk, reduce costs, and boost profits.
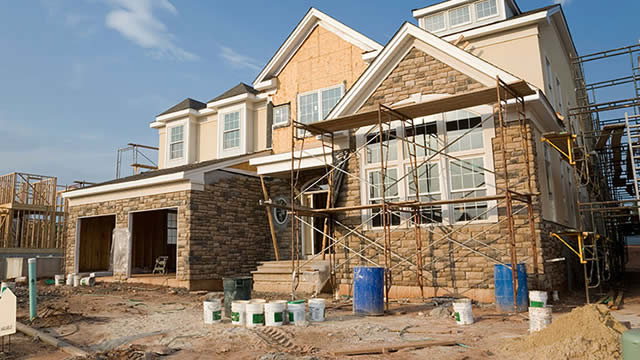
KB Home NYSE: KBH is not out of the weeds, with its revenue contracting, orders and backlog declining, and margins under pressure, but these forces are already priced into its stock. Housing market woes, inflation, and high interest rates are no secret.

Housing Stocks Back in Spotlight.
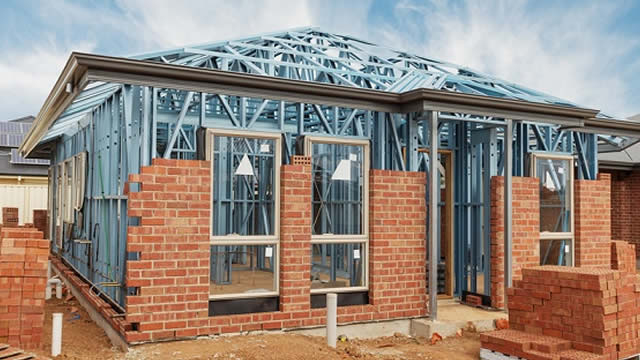
KBH's built-to-order reset is giving management better visibility on deliveries, margins and backlog trends despite a tough spring housing market.
Key metrics vs top competitors for KB Home (KBH)
| Company | Price | Market Cap | P/E Ratio | Rev Growth (1Y) | Net Margin | ROE | Div Yield |
|---|---|---|---|---|---|---|---|
| $58.68 | $3.68B | 9.54 | -10.01% | 6.88% | 10.77% | 1.69% | |
| $155.72 | $44.16B | 13.46 | -6.93% | 9.51% | 12.94% | — | |
| $86.74 | $21.54B | 10.87 | -3.54% | 5.39% | 7.98% | — | |
| $129.92 | $24.96B | 11.68 | -3.54% | 12.14% | 15.92% | — | |
| $151.64 | $14.36B | 11.24 | 1.11% | 11.66% | 15.47% | — | |
| $6693.69 | $18.07B | 15.33 | -2.08% | 12.77% | 32.66% | — |
KB Home (KBH) vs competitors — business, growth, and fundamentals comparison against the closest industry rivals.
KB Home (KBH) SEC filings — annual & quarterly reports (10-K, 10-Q)
Jun 23, 2026·SEC
May 1, 2026·SEC
Apr 24, 2026·SEC
Get notified when KBH posts new earnings or crosses analyst targets
Free. No account needed. Unsubscribe any time.
KB Home (KBH) stock FAQ — growth, dividends, profitability & financials explained
KB Home (KBH) reported $5.50B in revenue for fiscal year 2025. This represents a 214% increase from $1.75B in 1996.
KB Home (KBH) saw revenue decline by 10.0% over the past year.
Yes, KB Home (KBH) is profitable, generating $272.1M in net income for fiscal year 2025 (6.9% net margin).
Yes, KB Home (KBH) pays a dividend with a yield of 1.69%. This makes it attractive for income-focused investors.
KB Home (KBH) has a return on equity (ROE) of 10.8%. This is reasonable for most industries.
KB Home (KBH) generated $340.3M in free cash flow for fiscal year 2025. Positive FCF indicates the company can fund dividends, buybacks, or reinvestment.