Fool - Investing News·4 days ago
iShares Silver ETF Tops Global X Rival in Yield and Five-Year ReturnsCompare cost, liquidity, and portfolio makeup as two leading silver miner ETFs take different approaches to sector exposure.
 Hecla Mining Company(HL)Earnings, Financials & Key Ratios
Hecla Mining Company (HL) stock price & volume — 10-year historical chart
Investment Thesis • Updated 2026Q1
the company's ability to achieve a 4.94 current ratio while eliminating all debt suggests a significantly de-risked balance sheet profile.
Hecla Mining Company (HL) revenue, earnings & EPS growth — 3, 5 & 10-year CAGR
Hecla Mining Company (HL) EPS & revenue vs analyst estimates — last 4 quarters
| Quarter | Date | EPS (Act vs Est) | Revenue (Act vs Est) |
|---|---|---|---|
| Q2 2026Latest | May 5, 2026 | $0.24vs $0.27-11.1% | $411Mvs $408M+0.9% |
| Q1 2026 | Feb 17, 2026 | $0.19vs $0.16+16.6% | $448Mvs $401M+11.8% |
| Q4 2025 | Nov 5, 2025 | $0.12vs $0.10+23.7% | $410Mvs $295M+38.8% |
| Q3 2025 | Aug 6, 2025 | $0.08vs $0.05+60.0% | $304Mvs $258M+18.0% |
Recent stock market news and headlines for Hecla Mining Company (HL)
Compare cost, liquidity, and portfolio makeup as two leading silver miner ETFs take different approaches to sector exposure.
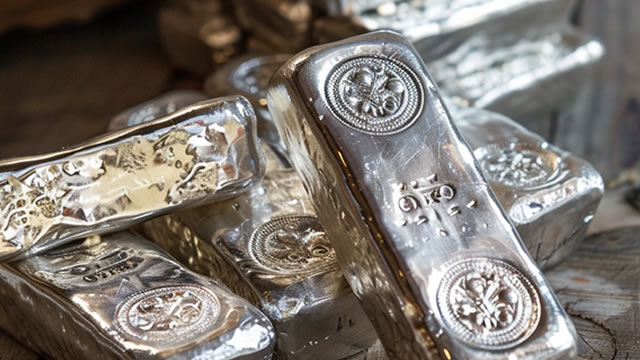
Silver is approaching what many technical traders would describe as a make-or-break moment. After a sharp rally over the past two years, the precious metal has retreated to a long-term rising trendline that has supported its bull market since early 2024.
Key metrics vs top competitors for Hecla Mining Company (HL)
| Company | Price | Market Cap | P/E Ratio | Rev Growth (1Y) | Net Margin | ROE | Div Yield |
|---|---|---|---|---|---|---|---|
| $16.46 | $11.04B | 33.59 | 53.03% | 22.61% | 13.89% | 0.09% | |
| $45.02 | $18.97B | 17.25 | 30.63% | 31.69% | 19.63% | — | |
| $16.99 | $11.06B | 18.88 | 96.41% | 31.15% | 15.17% | — | |
| $8.51 | $2.52B | -19.79 | 115.25% | -3.48% | -3.75% | — | |
| $8.68 | $2.64B | 9.64 | -9.6% | 31.11% | 20.1% | — | |
| $98.20 | $108.81B | 15.32 | 19.08% | 30.54% | 15.58% | — |
Hecla Mining Company (HL) vs competitors — business, growth, and fundamentals comparison against the closest industry rivals.
Hecla Mining Company (HL) SEC filings — annual & quarterly reports (10-K, 10-Q)
May 5, 2026·SEC
Apr 10, 2026·SEC
Mar 25, 2026·SEC
Get notified when HL posts new earnings or crosses analyst targets
Free. No account needed. Unsubscribe any time.
Hecla Mining Company (HL) stock FAQ — growth, dividends, profitability & financials explained
Hecla Mining Company (HL) reported $1.57B in revenue for fiscal year 2025. This represents a 894% increase from $158.3M in 1996.
Hecla Mining Company (HL) grew revenue by 53.0% over the past year. This is strong growth.
Yes, Hecla Mining Company (HL) is profitable, generating $559.3M in net income for fiscal year 2025 (22.6% net margin).
Hecla Mining Company (HL) does not currently pay a meaningful dividend. The company may be reinvesting profits for growth.
Hecla Mining Company (HL) has a return on equity (ROE) of 13.9%. This is reasonable for most industries.
Hecla Mining Company (HL) generated $472.3M in free cash flow for fiscal year 2025. Positive FCF indicates the company can fund dividends, buybacks, or reinvestment.