
TMC The Metals Company is attempting to build a mining operation under the ocean. USA Rare Earth has rare-earth metals processing assets and is looking to build a rare-earth metals mine.

Trilogy Metals Inc. (TMQ) stock price & volume — 10-year historical chart
Investment Thesis • Updated 2026Q1
the company's total reliance on a $47.8 million cash reserve to fund ongoing administrative losses of $4.7 million per quarter, combined with indefinite regulatory delays, presents an unfavorable risk-reward proposition.
Trilogy Metals Inc. (TMQ) revenue, earnings & EPS growth — 3, 5 & 10-year CAGR
Trilogy Metals Inc. (TMQ) EPS & revenue vs analyst estimates — last 4 quarters
| Quarter | Date | EPS (Act vs Est) | Revenue (Act vs Est) |
|---|---|---|---|
| Q2 2026Latest | Apr 2, 2026 | $0.03vs $0.01-200.0% | — |
| Q2 2026 | Apr 1, 2026 | $0.04vs $0.01-300.0% | — |
| Q1 2026 | Feb 17, 2026 | $0.11vs $0.11+0.0% | — |
| Q4 2025 | Sep 30, 2025 | $0.01vs $0.01+0.0% | — |
Recent stock market news and headlines for Trilogy Metals Inc. (TMQ)
TMC The Metals Company is attempting to build a mining operation under the ocean. USA Rare Earth has rare-earth metals processing assets and is looking to build a rare-earth metals mine.
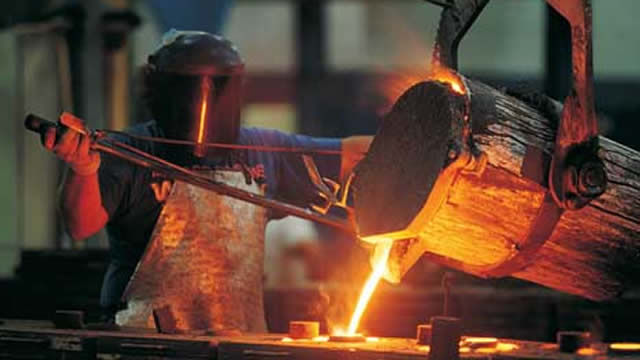
The Department of Defense's Office of Strategic Capital on Thursday announced a $725 million conditional loan commitment with Energy Fuels Inc. (AMEX:UUUU) to expand domestic rare earth processing at its White Mesa Mill in Utah and fund a new rare earth metals and alloy facility in the U.S.

Trilogy Metals offers exposure to high-grade Arctic and Bornite copper projects in Alaska, with South32 as a JV partner. Arctic's robust feasibility metrics—5% copper equivalent, $1.1B NPV8, 22.8% IRR, low cash cost—anchor the investment case. Ambler Road permitting and U.S. critical minerals policy are pivotal catalysts; project value hinges on infrastructure progress.

Key metrics vs top competitors for Trilogy Metals Inc. (TMQ)
| Company | Price | Market Cap | P/E Ratio | Rev Growth (1Y) | Net Margin | ROE | Div Yield |
|---|---|---|---|---|---|---|---|
| $3.23 | $557.32M | -12.42 | — | — | -32.88% | — | |
| $4.39 | $1.17B | -13.30 | 17.71% | -36.33% | -41.36% | — | |
| $9.24 | $182.17M | -2.90 | -0.05% | -27.37% | — | — | |
| $59.27 | $85.18B | 38.99 | 1.12% | 10.34% | 8.91% | — | |
| $169.75 | $141.63B | 32.40 | 17.38% | 34.16% | 45.67% | — | |
| $59.35 | $28.58B | 29.81 | 18.56% | 14.91% | 7.09% | — |
Trilogy Metals Inc. (TMQ) vs competitors — business, growth, and fundamentals comparison against the closest industry rivals.
Trilogy Metals Inc. (TMQ) SEC filings — annual & quarterly reports (10-K, 10-Q)
Jun 9, 2026·SEC
Jun 1, 2026·SEC
May 15, 2026·SEC
Get notified when TMQ posts new earnings or crosses analyst targets
Free. No account needed. Unsubscribe any time.
Trilogy Metals Inc. (TMQ) stock FAQ — growth, dividends, profitability & financials explained
Trilogy Metals Inc. (TMQ) reported a net loss of $45.7M for fiscal year 2025.
Trilogy Metals Inc. (TMQ) has a return on equity (ROE) of -32.9%. Negative ROE indicates the company is unprofitable.
Trilogy Metals Inc. (TMQ) had negative free cash flow of $5.2M in fiscal year 2025, likely due to heavy capital investments.