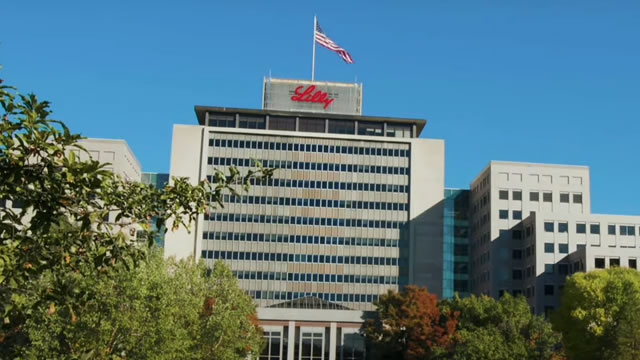
AboutEli Lilly and Company discovers, develops, and markets human pharmaceuticals worldwide. It offers Basaglar, Humalog, Humalog Mix 75/25, Humalog U-100, Humalog U-200, Humalog Mix 50/50, insulin lispro, insulin lispro protamine, insulin lispro mix 75/25, Humulin, Humulin 70/30, Humulin N, Humulin R, and Humulin U-500 for diabetes; and Jardiance, Trajenta, and Trulicity for type 2 diabetes. The company provides Alimta for non-small cell lung cancer (NSCLC) and malignant pleural mesothelioma; Cyramza for metastatic gastric cancer, gastro-esophageal junction adenocarcinoma, metastatic NSCLC, metastatic colorectal cancer, and hepatocellular carcinoma; Erbitux for colorectal cancers, and various head and neck cancers; Retevmo for metastatic NSCLC, medullary thyroid cancer, and thyroid cancer; Tyvyt for relapsed or refractory classic Hodgkin's lymph and non-squamous NSCLC; and Verzenio for HR+, HER2- metastatic breast cancer, node positive, and early breast cancer. It offers Olumiant for rheumatoid arthritis; and Taltz for plaque psoriasis, psoriatic arthritis, ankylosing spondylitis, and non-radiographic axial spondylarthritis. The company offers Cymbalta for depressive disorder, diabetic peripheral neuropathic pain, generalized anxiety disorder, fibromyalgia, and chronic musculoskeletal pain; Emgality for migraine prevention and episodic cluster headache; and Zyprexa for schizophrenia, bipolar I disorder, and bipolar maintenance. Its Bamlanivimab and etesevimab, and Bebtelovimab for COVID-19; Cialis for erectile dysfunction and benign prostatic hyperplasia; and Forteo for osteoporosis. The company has collaborations with Incyte Corporation; Boehringer Ingelheim Pharmaceuticals, Inc.; AbCellera Biologics Inc.; Junshi Biosciences; Regor Therapeutics Group; Lycia Therapeutics, Inc.; Kumquat Biosciences Inc.; Entos Pharmaceuticals Inc.; and Foghorn Therapeutics Inc. Eli Lilly and Company was founded in 1876 and is headquartered in Indianapolis, Indiana.Show more