Zacks Investment Research·5 days ago
Darden Stock Outlook Centers on Growth Brands and Cost RisksDRI enters fiscal 2027 with growth from LongHorn, digital initiatives and new restaurants, while inflation and cautious spending test margins.
 Darden Restaurants, Inc.(DRI)Earnings, Financials & Key Ratios
Darden Restaurants, Inc. (DRI) stock price & volume — 10-year historical chart
Investment Thesis • Updated 2026Q4
while the company demonstrates robust OCF/NI conversion ratios consistently above 1.30, the combination of a 20.57 P/E ratio and a tight 0.31 current ratio suggests limited margin for error in a volatile consumer environment.
Darden Restaurants, Inc. (DRI) revenue, earnings & EPS growth — 3, 5 & 10-year CAGR
Darden Restaurants, Inc. (DRI) EPS & revenue vs analyst estimates — last 4 quarters
| Quarter | Date | EPS (Act vs Est) | Revenue (Act vs Est) |
|---|---|---|---|
| Q3 2026Latest | Jun 25, 2026 | $3.66vs $3.63+0.8% | $3.7Bvs $3.7B-0.3% |
| Q2 2026 | Mar 19, 2026 | $2.95vs $2.94+0.3% | $3.3Bvs $3.3B+0.3% |
| Q4 2025 | Dec 18, 2025 | $2.08vs $2.10-1.0% | $3.1Bvs $3.1B+0.9% |
| Q4 2025 | Sep 18, 2025 | $1.97vs $2.00-1.5% | $3.0Bvs $3.0B+0.1% |
Recent stock market news and headlines for Darden Restaurants, Inc. (DRI)
DRI enters fiscal 2027 with growth from LongHorn, digital initiatives and new restaurants, while inflation and cautious spending test margins.
Darden combines earnings growth, cash returns and a lower valuation multiple, but estimate cuts and inflation keep investors weighing the stock's outlook.
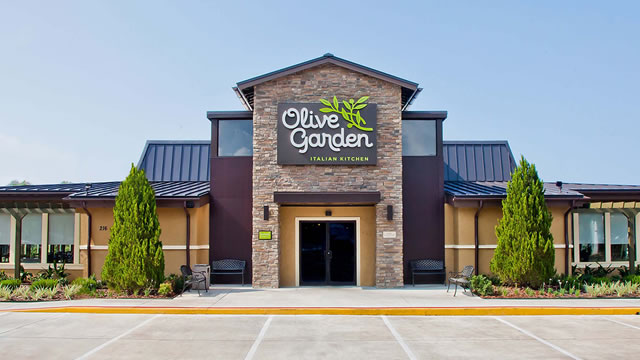
DRI is balancing digital growth, brand diversification and value-focused pricing as inflation and consumer spending trends shape its margin outlook.
In this article series, I summarize dividend announcements of the past week. Thirteen companies in my database (including 7 banks) announced dividend increases. JPMorgan Chase stands out with a 10% dividend hike, an A+ safety grade, and a new $50B buyback, and trades only 3.35% above fair value. Matson is the week's high-quality non-bank, boasting a 7.34 quality score, 9.4 safety score, and a conservative 10% payout ratio.

Darden Restaurants' NYSE: DRI stock price is on track to hit new highs because its high-quality business is outperforming peers, growing across brands, generating ample cash flows, and sustaining a robust capital return program. The capital return program is a significant factor in 2026, with investors reducing exposure to high-risk tech stocks in favor of safer havens.
Key metrics vs top competitors for Darden Restaurants, Inc. (DRI)
| Company | Price | Market Cap | P/E Ratio | Rev Growth (1Y) | Net Margin | ROE | Div Yield |
|---|---|---|---|---|---|---|---|
| $204.50 | $23.42B | 19.68 | 9.39% | 9.13% | 53.41% | 2.94% | |
| $175.30 | $7.52B | 21.07 | 21.95% | 8.07% | 123.43% | — | |
| $187.03 | $12.29B | 30.66 | 9.39% | 6.85% | 27.87% | — | |
| $7.98 | $680.12M | 126.47 | 0.14% | 0.55% | 5.85% | — | |
| $6.25 | $321.87M | 15.24 | -2.5% | 2.24% | — | — | |
| $77.74 | $3.86B | 25.32 | 4.75% | 4.34% | 38.34% | — |
Darden Restaurants, Inc. (DRI) vs competitors — business, growth, and fundamentals comparison against the closest industry rivals.
Darden Restaurants, Inc. (DRI) SEC filings — annual & quarterly reports (10-K, 10-Q)
Jun 25, 2026·SEC
Mar 19, 2026·SEC
Dec 18, 2025·SEC
Jul 18, 2025·SEC
Get notified when DRI posts new earnings or crosses analyst targets
Free. No account needed. Unsubscribe any time.
Darden Restaurants, Inc. (DRI) stock FAQ — growth, dividends, profitability & financials explained
Darden Restaurants, Inc. (DRI) reported $13.21B in revenue for fiscal year 2026. This represents a 317% increase from $3.17B in 1997.
Darden Restaurants, Inc. (DRI) grew revenue by 9.4% over the past year. This is steady growth.
Yes, Darden Restaurants, Inc. (DRI) is profitable, generating $1.21B in net income for fiscal year 2026 (9.1% net margin).
Yes, Darden Restaurants, Inc. (DRI) pays a dividend with a yield of 2.94%. This makes it attractive for income-focused investors.
Darden Restaurants, Inc. (DRI) has a return on equity (ROE) of 53.4%. This is excellent, indicating efficient use of shareholder capital.
Darden Restaurants, Inc. (DRI) generated $1.12B in free cash flow for fiscal year 2026. Positive FCF indicates the company can fund dividends, buybacks, or reinvestment.