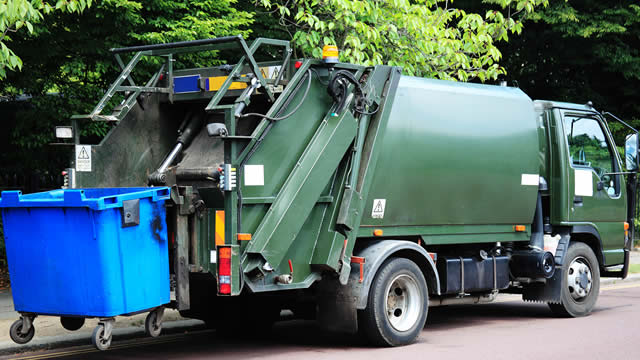
AboutWaste Connections, Inc. provides non-hazardous waste collection, transfer, disposal, and resource recovery services in the United States and Canada. It offers collection services to residential, commercial, municipal, industrial, and exploration and production (E&P) customers; landfill disposal services; and recycling services for various recyclable materials, including compost, cardboard, mixed paper, plastic containers, glass bottles, and ferrous and aluminum metals. The company also owns and operates transfer stations that receive compact and/or load waste to be transported to landfills or treatment facilities through truck, rail, or barge; and intermodal services for the rail haul movement of cargo and solid waste containers in the Pacific Northwest through a network of intermodal facilities. In addition, it provides E&P waste treatment, recovery, and disposal services for waste resulting from oil and natural gas exploration and production activity, such as drilling fluids, drill cuttings, completion fluids, and flowback water; production wastes and produced water during a well's operating life; contaminated soils that require treatment during site reclamation; and substances, which require clean-up after a spill, reserve pit clean-up, or pipeline rupture. Further, the company offers leasing services to its customers. As of December 31, 2021, it owned 334 solid waste collection operations; 142 transfer stations; 61 municipal solid waste (MSW) landfills; 12 E&P waste landfills; 14 non-MSW landfills; 71 recycling operations; 4 intermodal operations; 23 E&P liquid waste injection wells; and 19 E&P waste treatment and oil recovery facilities. The company also operates an additional 53 transfer stations, 10 MSW landfills, and 2 intermodal operations. Waste Connections, Inc. was founded in 1997 and is based in Woodbridge, Canada.Show more