VCP ScannerFree US Stock Screener & Financial AnalysisFree US Stock Screener
ScreenerThemes
DCF ValuationCalculate intrinsic value of US stocks
Market ValuationBuffett indicator, CAPE & macro gauges
Total ReturnSee dividends + price return history
DCA CalculatorSimulate recurring buys & compounding
Earnings
FAANG & Tech
AAPL vs MSFTNVDA vs AMDGOOGL vs META
Cloud & Cyber
CRM vs NOWCRWD vs PANWSNOW vs DDOG
Consumer & Auto
TSLA vs FAMZN vs WMTNFLX vs DIS
Finance & Crypto
JPM vs BACV vs MACOIN vs MSTR
Pharma & Energy
LLY vs NVOJNJ vs PFEXOM vs CVX
Compare Any Stocks...
WatchlistInsider
ScreenerThemes
Earnings
WatchlistInsider
RGLD
← Back to Screener
VCP ScannerFree US Stock Screener & Financial Analysis

Find stocks. Verify deeply. Act with conviction.

Data updated daily

Product

  • Screener
  • Themes
  • Valuation
  • Total Return
  • DCA Calculator
  • News
  • Earnings

Resources

  • Market Valuation
  • Compare
  • Insider Activity
  • Methodology
  • How It Works
  • Glossary
  • Learn

Get Ideas

Get weekly stock ideas — free

© 2026 VCP Scanner
AboutPrivacyTerms
Not financial advice. Do your own research.
ScreenerNewsCompareWatchlist
RGLDRoyal Gold, Inc.
$196.61$13.6B
Overview & Verdict
Overview
Valuation & Forecasts
Valuation ModelsEstimatesDCF Model
Price & Analyst Data
Analyst TargetsPrice HistoryTechnical Analysis
Financial Statements
Income StatementBalance SheetCash FlowRatios & Margins
Performance
P/E HistoryRevenue HistoryEarnings HistoryDividend HistoryTotal Return
Ownership
Holders

RGLD logoRoyal Gold, Inc.(RGLD)Earnings, Financials & Key Ratios

RGLD•NASDAQ
$201.91
30.2× P/E·Price updated Jul 6, 2026
SectorBasic MaterialsIndustryGoldSub-IndustryGold royalty and streaming companies
AboutRoyal Gold, Inc., together with its subsidiaries, acquires and manages precious metal streams, royalties, and related interests. It focuses on acquiring stream and royalty interests or to finance projects that are in production or in development stage in exchange for stream or royalty interests, which primarily consists of gold, silver, copper, nickel, zinc, lead, and cobalt. As of June 30, 2022, the Company owned interests in 185 properties on five continents, including interests on 41 producing mines and 19 development stage projects. Its stream and royalty interests on properties are located in the United States, Canada, Chile, the Dominican Republic, Australia, Africa, Mexico, and internationally. Royal Gold, Inc. was incorporated in 1981 and is headquartered in Denver, Colorado.Show more
  • Revenue$1.03B+44.6%
  • EBITDA$842M+46.6%
  • Net Income$466M+40.4%
  • EPS (Diluted)6.69+32.5%
  • Gross Margin69.27%-19.7%
  • EBITDA Margin81.69%+1.4%
  • Operating Margin64.5%+6.9%
  • Net Margin45.25%-2.9%
  • ROE9.02%-18.0%

RGLD Price & Volume

Royal Gold, Inc. (RGLD) stock price & volume — 10-year historical chart

Loading chart...

Accelerating Streaming Revenue Drives Portfolio Expansion Strategy

Investment Thesis • Updated 2026Q1

VerdictNeutral
Growth:Accelerating
Profitability:Strong
Financial:Healthy
Cash Flow:Robust
Primary Risk:Concentrated anchor asset exposure

Key Thesis Takeaways

  • Royal Gold has successfully transitioned into a larger, more capital-intensive streaming entity, evidenced by a total asset base expansion to $9.5 billion in 2026Q1.
  • While the company demonstrates significant operating leverage with a 63.3% operating margin, investors should remain cautious regarding the concentration of anchor assets and the volatility inherent in acquisition-driven capital deployment.
  • The firm's ability to maintain a conservative 0.08 debt-to-equity ratio while scaling operations suggests a disciplined approach to long-term value creation despite periodic earnings fluctuations.

Verdict Logic

while the 144.8% revenue growth in 2026Q1 is compelling, the current P/E of 31.08 and the inherent risks of concentrated anchor asset exposure warrant a cautious valuation assessment.

RGLD Growth Metrics

Royal Gold, Inc. (RGLD) revenue, earnings & EPS growth — 3, 5 & 10-year CAGR

Revenue CAGR

10 Years11.22%
5 Years10.84%
3 Years20.01%
TTM72.07%

Profit CAGR

10 Years-
5 Years9.04%
3 Years24.96%
TTM59.13%

EPS CAGR

10 Years-
5 Years7.78%
3 Years22.6%
TTM38.91%

Return on Capital

10 Years8.2%
5 Years10.81%
3 Years10.82%
Last Year10.45%

RGLD Recent Earnings

Royal Gold, Inc. (RGLD) EPS & revenue vs analyst estimates — last 4 quarters

Full history →
●Beat EPS 7/12 qtrs (58%)●Beat Revenue 7/12 qtrs (58%)
Q2 2026Latest
May 6, 2026
Metric
Actual
Est
EPS
$3.11+12.3%
$2.77
Rev
$469M-0.6%
$472M
Q1 2026
Feb 18, 2026
Metric
Actual
Est
EPS
$1.92-25.9%
$2.59
Rev
$375M-4.2%
$392M
Q4 2025
Nov 5, 2025
Metric
Actual
Est
EPS
$2.06-4.2%
$2.15
Rev
$252M-0.8%
$254M
Q3 2025
Aug 6, 2025
Metric
Actual
Est
EPS
$1.81+6.5%
$1.70
Rev
$210M-1.9%
$214M
QuarterDateEPS (Act vs Est)Revenue (Act vs Est)
Q2 2026LatestMay 6, 2026
$3.11vs $2.77+12.3%
$469Mvs $472M-0.6%
Q1 2026Feb 18, 2026
$1.92vs $2.59-25.9%
$375Mvs $392M-4.2%
Q4 2025Nov 5, 2025
$2.06vs $2.15-4.2%
$252Mvs $254M-0.8%
Q3 2025Aug 6, 2025
$1.81vs $1.70+6.5%
$210Mvs $214M-1.9%
Based on last 12 quarters of dataView full earnings history →

Latest RGLD News

Recent stock market news and headlines for Royal Gold, Inc. (RGLD)

Zacks Investment Research·Jun 22, 2026
New Strong Sell Stocks for June 22nd

WMS, AAMI and RGLD have been added to the Zacks Rank #5 (Strong Sell) List on June 22nd, 2026.

Seeking Alpha·Jun 17, 2026
Royal Gold, Inc. (RGLD) Presents at Renmark Financial Communications Virtual Non-Deal Roadshow Series Transcript

Royal Gold, Inc. (RGLD) Presents at Renmark Financial Communications Virtual Non-Deal Roadshow Series Transcript

Seeking Alpha·Jun 17, 2026
Royal Gold: A Record Quarter, A Derisked Portfolio, And A Cheaper Stock

Royal Gold is upgraded from Buy to Strong Buy, with the investment case strengthened by record Q1 results and an attractive valuation. RGLD posted its best quarter ever, doubling key metrics year-over-year, and enhanced its balance sheet with $1.1B in liquidity and a $2B revolver. The company derisked its portfolio by converting Hod Maden equity into a royalty, aligning with its core streaming model and reducing capital commitments.

Seeking Alpha·Jun 16, 2026
Royal Gold For A Golden Financial Fortress

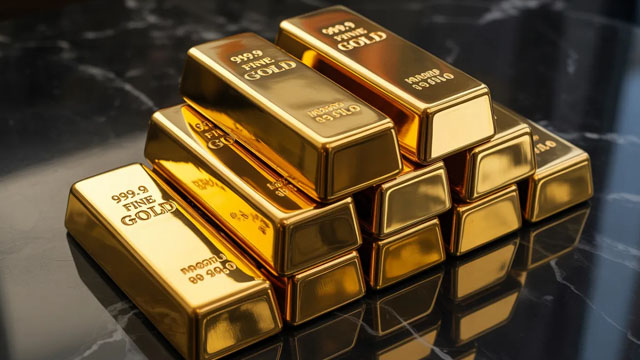
Royal Gold is attractively valued, offering leveraged gold exposure without the risks of physical ownership. RGLD posted Q1 2026 revenue up 142.5% YoY, driven by higher gold prices and recent acquisitions, with an 83% adjusted EBITDA margin. With a robust pipeline—79 producing properties and a strong balance sheet—RGLD is positioned for sustained growth and further acquisitions.
Peers Comparison

Key metrics vs top competitors for Royal Gold, Inc. (RGLD)

Full Screener →
CompanyPriceMarket CapP/E RatioRev Growth (1Y)Net MarginROEDiv Yield
RGLD logoRGLDRoyal Gold, Inc.Current
$201.91$14.02B30.1844.57%45.25%9.02%0.84%
WPM logoWPMWheaton Precious Metals Corp.
$115.24$52.33B35.0383.33%65.55%21.33%—
FNV logoFNVFranco-Nevada Corporation
$212.77$41.02B36.3163.69%65.12%18.68%—
OR logoOROR Royalties Inc.
$30.81$5.78B27.7647.52%78.1%16.55%—
NEM logoNEMNewmont Corporation
$98.20$108.81B15.3219.08%30.54%15.58%—
AEM logoAEMAgnico Eagle Mines Limited
$154.94$77.48B17.4943.71%39.46%22.02%—

Compare RGLD vs Peers

Royal Gold, Inc. (RGLD) vs competitors — business, growth, and fundamentals comparison against the closest industry rivals.

Closest Rival

vs WPM

Most directly comparable listed peer for RGLD.

Scale Benchmark

vs NEM

Larger-name benchmark to compare RGLD against a more recognizable public peer.

Peer Set

Compare Top 5

vs WPM, FNV, OR, NEM

RGLD SEC Filings & Documents

Royal Gold, Inc. (RGLD) SEC filings — annual & quarterly reports (10-K, 10-Q)

8-K Announcements

6
Material company update

May 6, 2026·SEC

Material company update

Mar 31, 2026·SEC

Material company update

Feb 18, 2026·SEC

10-K Annual Reports

3
FY 2026

Feb 19, 2026·SEC

FY 2025

Feb 13, 2025·SEC

FY 2024

Feb 15, 2024·SEC

10-Q Quarterly Reports

6
FY 2026

May 7, 2026·SEC

FY 2025

Nov 6, 2025·SEC

FY 2025

Aug 7, 2025·SEC

Get notified when RGLD posts new earnings or crosses analyst targets

Free. No account needed. Unsubscribe any time.

Free. Unsubscribe any time.

RGLD Frequently Asked Questions

Royal Gold, Inc. (RGLD) stock FAQ — growth, dividends, profitability & financials explained

Growth & Financials
What is Royal Gold, Inc.'s revenue?

Royal Gold, Inc. (RGLD) reported $1.31B in revenue for fiscal year 2025. This represents a 15829% increase from $8.2M in 1996.

How fast is Royal Gold, Inc. growing?

Royal Gold, Inc. (RGLD) grew revenue by 44.6% over the past year. This is strong growth.

Is RGLD profitable?

Yes, Royal Gold, Inc. (RGLD) is profitable, generating $633.9M in net income for fiscal year 2025 (45.2% net margin).

Dividend & Returns
Does RGLD pay dividends?

Yes, Royal Gold, Inc. (RGLD) pays a dividend with a yield of 0.84%. This makes it attractive for income-focused investors.

What is RGLD's return on equity?

Royal Gold, Inc. (RGLD) has a return on equity (ROE) of 9.0%. This is below average, suggesting room for improvement.

What is Royal Gold, Inc.'s free cash flow?

Royal Gold, Inc. (RGLD) had negative free cash flow of $244.2M in fiscal year 2025, likely due to heavy capital investments.


What if you invested $1,000 in RGLD back in 1996?

Total return calculator · dividends reinvested · 30+ years of data

See returns →