Schaeffers Research·5 days ago
16 Stocks That Could Squeeze Shorts This MonthThe semiconductor rotation and memory stock profit taking puts investors in a bind trying to call the top.

 D-Wave Quantum Inc.(QBTS)Earnings, Financials & Key Ratios
D-Wave Quantum Inc. (QBTS) stock price & volume — 10-year historical chart
Investment Thesis • Updated 2026Q1
as evidenced by a -408.22% operating margin and a consistent pattern of value destruction reflected in the $1.0 billion retained earnings deficit.
D-Wave Quantum Inc. (QBTS) revenue, earnings & EPS growth — 3, 5 & 10-year CAGR
D-Wave Quantum Inc. (QBTS) EPS & revenue vs analyst estimates — last 4 quarters
| Quarter | Date | EPS (Act vs Est) | Revenue (Act vs Est) |
|---|---|---|---|
| Q2 2026Latest | May 12, 2026 | $0.05vs $0.08+34.7% | $3Mvs $4M-31.9% |
| Q1 2026 | Feb 26, 2026 | $0.12vs $0.05-140.0% | $3Mvs $4M-26.5% |
| Q4 2025 | Nov 6, 2025 | $0.41vs $0.07-525.1% | $4Mvs $3M+23.3% |
| Q3 2025 | Aug 7, 2025 | $0.55vs $0.06-816.7% | $3Mvs $3M+2.2% |
Recent stock market news and headlines for D-Wave Quantum Inc. (QBTS)
The semiconductor rotation and memory stock profit taking puts investors in a bind trying to call the top.
Although the growth rates coming out of the quantum computing segment look genuinely spectacular on paper, Wall Street has stood on this exact ledge before, and the fall has never been gentle.

QBTS gets a $1.5M NSF grant to support fault-tolerant quantum computing research, extending U.S. government backing as it advances dual-rail technology.

Quantum stocks may look exciting, but the real test could be the cash runway. Here's what investors should watch before the race to 2028 heats up.
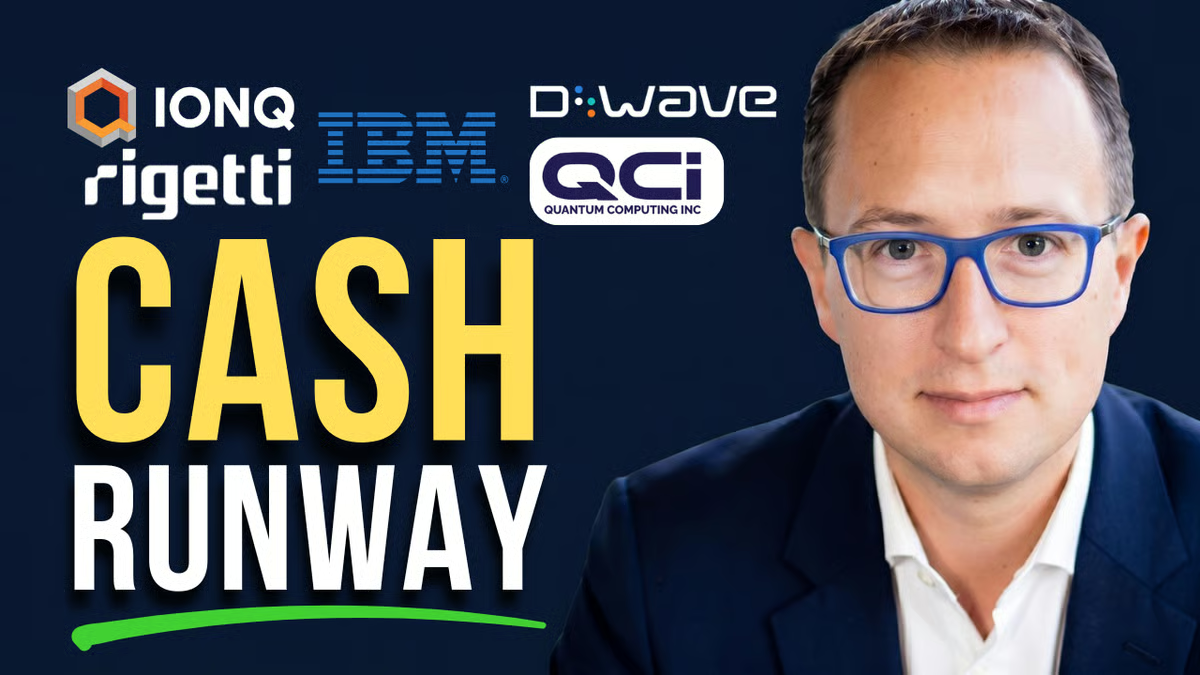
Quantum computing is the ultimate long-duration bet. The physics works, commercial revenue is thin, and every pure-play player is burning cash toward a payoff years away.

Key metrics vs top competitors for D-Wave Quantum Inc. (QBTS)
| Company | Price | Market Cap | P/E Ratio | Rev Growth (1Y) | Net Margin | ROE | Div Yield |
|---|---|---|---|---|---|---|---|
| $21.06 | $7.73B | -18.97 | 178.54% | -1444.1% | -77.62% | — | |
| $45.36 | $16.63B | -24.92 | 201.85% | 148.08% | 9.03% | — | |
| $16.55 | $5.5B | -23.64 | -34.31% | -2253.59% | -43.94% | — | |
| $8.69 | $1.19B | -79.00 | 82.84% | -916.15% | -3.55% | — | |
| $19.84 | $310.53M | -7.75 | 80.89% | -5271.99% | -360.48% | — | |
| $306.13 | $287.16B | 27.41 | 7.62% | 15.61% | 35.44% | — |
D-Wave Quantum Inc. (QBTS) vs competitors — business, growth, and fundamentals comparison against the closest industry rivals.
D-Wave Quantum Inc. (QBTS) SEC filings — annual & quarterly reports (10-K, 10-Q)
May 21, 2026·SEC
May 13, 2026·SEC
May 12, 2026·SEC
Feb 26, 2026·SEC
Get notified when QBTS posts new earnings or crosses analyst targets
Free. No account needed. Unsubscribe any time.
D-Wave Quantum Inc. (QBTS) stock FAQ — growth, dividends, profitability & financials explained
D-Wave Quantum Inc. (QBTS) reported $12.4M in revenue for fiscal year 2025. This represents a 141% increase from $5.2M in 2020.
D-Wave Quantum Inc. (QBTS) grew revenue by 178.5% over the past year. This is strong growth.
D-Wave Quantum Inc. (QBTS) reported a net loss of $368.0M for fiscal year 2025.
D-Wave Quantum Inc. (QBTS) has a return on equity (ROE) of -77.6%. Negative ROE indicates the company is unprofitable.
D-Wave Quantum Inc. (QBTS) had negative free cash flow of $102.2M in fiscal year 2025, likely due to heavy capital investments.