Golar LNG's 2nd Quarter 2026 results will be released before the market opens on Thursday, August 13, 2026. In connection with this a webcast presentation will be held at 08:00am Eastern Time (1:00pm London Time) on Thursday August 13, 2026.

Cheniere Energy, Inc. (LNG) stock price & volume — 10-year historical chart
Investment Thesis • Updated 2026Q1
while the firm maintains a significant infrastructure asset base, the current 20.58 P/FCF multiple and the tightening liquidity profile, evidenced by a 0.57 current ratio, warrant caution until regulatory headwinds subside.
Cheniere Energy, Inc. (LNG) revenue, earnings & EPS growth — 3, 5 & 10-year CAGR
Cheniere Energy, Inc. (LNG) EPS & revenue vs analyst estimates — last 4 quarters
| Quarter | Date | EPS (Act vs Est) | Revenue (Act vs Est) |
|---|---|---|---|
| Q2 2026Latest | May 7, 2026 | $16.65vs $4.25-491.8% | $5.9Bvs $5.7B+3.1% |
| Q1 2026 | Feb 26, 2026 | $10.71vs $3.80+181.8% | $5.5Bvs $5.6B-3.1% |
| Q4 2025 | Oct 30, 2025 | $4.75vs $2.91+63.2% | $4.4Bvs $4.6B-2.6% |
| Q3 2025 | Aug 7, 2025 | $7.30vs $2.49+193.2% | $4.5Bvs $4.3B+5.1% |
Recent stock market news and headlines for Cheniere Energy, Inc. (LNG)
Golar LNG's 2nd Quarter 2026 results will be released before the market opens on Thursday, August 13, 2026. In connection with this a webcast presentation will be held at 08:00am Eastern Time (1:00pm London Time) on Thursday August 13, 2026.
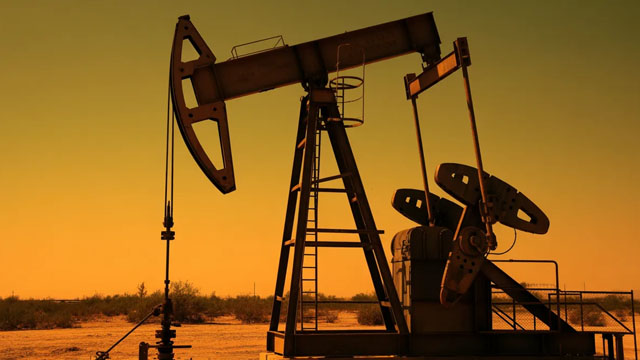
Middle East producers are pushing ahead with loading oil and liquefied natural gas despite fresh ship attacks in the Strait of Hormuz and renewed strikes between the U.S. and Iran in recent days, shipping data showed.

Cheniere Energy has dropped 23% from its March peak despite U.S. LNG now supplying nearly 60% of Europe's imported gas needs. Europe's gas storage sits roughly 140 LNG cargoes below normal safety levels, making a cold winter a stronger recovery catalyst than another geopolitical crisis.

Cheniere Energy is expanding capacity with new LNG trains, and execution continues as planned. Geopolitical risks in the Strait of Hormuz may benefit Cheniere over the long term.

Cenovus' gas-rich conventional and offshore assets position the company to benefit from rising LNG demand and stronger natural gas market fundamentals.

Key metrics vs top competitors for Cheniere Energy, Inc. (LNG)
| Company | Price | Market Cap | P/E Ratio | Rev Growth (1Y) | Net Margin | ROE | Div Yield |
|---|---|---|---|---|---|---|---|
| $255.00 | $53.44B | 10.57 | 24.44% | 27.15% | 46.07% | 0.8% | |
| $63.69 | $30.83B | 10.32 | 23.6% | 22.19% | — | — | |
| $7.81 | $2.07B | -6.68 | — | — | -16.65% | — | |
| $50.50 | $5.14B | 77.68 | 51.14% | 30.1% | 6.4% | — | |
| $0.37 | $104.57M | -0.06 | -36.4% | -168.8% | -309.49% | — | |
| $3.19 | $96.08M | -0.80 | 442.28% | -1136.38% | -144.52% | — |
Cheniere Energy, Inc. (LNG) vs competitors — business, growth, and fundamentals comparison against the closest industry rivals.
Cheniere Energy, Inc. (LNG) SEC filings — annual & quarterly reports (10-K, 10-Q)
May 15, 2026·SEC
May 7, 2026·SEC
Apr 28, 2026·SEC
Get notified when LNG posts new earnings or crosses analyst targets
Free. No account needed. Unsubscribe any time.
Cheniere Energy, Inc. (LNG) stock FAQ — growth, dividends, profitability & financials explained
Cheniere Energy, Inc. (LNG) reported $21.06B in revenue for fiscal year 2025. This represents a 21056900% increase from $0.1M in 1996.
Cheniere Energy, Inc. (LNG) grew revenue by 24.4% over the past year. This is strong growth.
Yes, Cheniere Energy, Inc. (LNG) is profitable, generating $1.48B in net income for fiscal year 2025 (27.1% net margin).
Yes, Cheniere Energy, Inc. (LNG) pays a dividend with a yield of 0.80%. This makes it attractive for income-focused investors.
Cheniere Energy, Inc. (LNG) has a return on equity (ROE) of 46.1%. This is excellent, indicating efficient use of shareholder capital.
Cheniere Energy, Inc. (LNG) generated $4.53B in free cash flow for fiscal year 2025. Positive FCF indicates the company can fund dividends, buybacks, or reinvestment.