Fool - Investing News·Jun 28, 2026
3 Artificial Intelligence (AI) Stocks I'd Buy Now and Never SellIn a completely AI-driven world, these companies could grow significantly in value.

 Arm Holdings plc American Depositary Shares(ARM)Earnings, Financials & Key Ratios
Arm Holdings plc American Depositary Shares (ARM) stock price & volume — 10-year historical chart
Investment Thesis • Updated 2026Q4
while the company exhibits strong architectural dominance, the current P/E ratio of 393.26 suggests that significant future growth is already priced into the shares, warranting caution regarding valuation.
Arm Holdings plc American Depositary Shares (ARM) revenue, earnings & EPS growth — 3, 5 & 10-year CAGR
Arm Holdings plc American Depositary Shares (ARM) EPS & revenue vs analyst estimates — last 4 quarters
| Quarter | Date | EPS (Act vs Est) | Revenue (Act vs Est) |
|---|---|---|---|
| Q2 2026Latest | May 6, 2026 | $0.60vs $0.58+3.4% | $1.5Bvs $1.5B+1.1% |
| Q1 2026 | Feb 4, 2026 | $0.43vs $0.41+4.9% | $1.2Bvs $1.2B+1.2% |
| Q4 2025 | Nov 5, 2025 | $0.39vs $0.33+18.6% | $1.1Bvs $1.1B+7.0% |
| Q3 2025 | Jul 30, 2025 | $0.35vs $0.35+0.3% | $1.1Bvs $1.1B-0.8% |
Recent stock market news and headlines for Arm Holdings plc American Depositary Shares (ARM)
In a completely AI-driven world, these companies could grow significantly in value.
Micron sees growth ahead for smartphones and PCs.
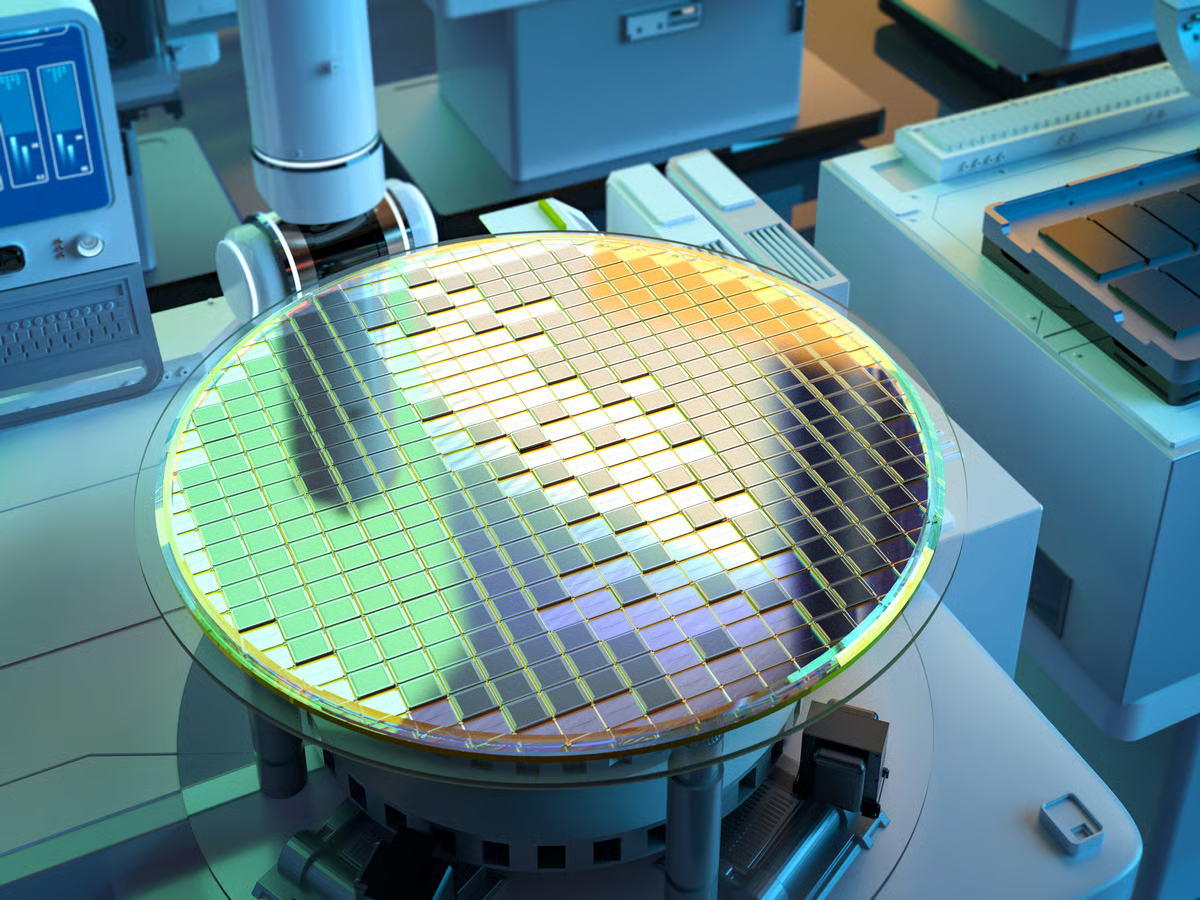
The AI boom promised to create a new generation of market winners.

Arm (NASDAQ:ARM | ARM Price Prediction) has been one of the wildest rides in semiconductors this year, and the question on every shareholder's mind is whether the current run still has gas in the tank.

Arm Holdings (NASDAQ:ARM | ARM Price Prediction) and Advanced Micro Devices (NASDAQ:AMD) both reported earnings within 24 hours of each other in early May.

Key metrics vs top competitors for Arm Holdings plc American Depositary Shares (ARM)
| Company | Price | Market Cap | P/E Ratio | Rev Growth (1Y) | Net Margin | ROE | Div Yield |
|---|---|---|---|---|---|---|---|
| $322.24 | $342.86B | 379.11 | 22.79% | 18.37% | 11.95% | — | |
| $44.64 | $1.24B | -101.45 | 2.49% | -10.47% | -3.89% | — | |
| $442.27 | $84.69B | 55.01 | 15.12% | 8.91% | 2.64% | — | |
| $375.77 | $103.64B | 92.55 | 14.12% | 21.18% | 21.06% | — | |
| $186.48 | $196.55B | 37.22 | 13.66% | 22.31% | 40.19% | — | |
| $122.20 | $613.57B | -2074.70 | -0.47% | -5.9% | -2.68% | — |
Arm Holdings plc American Depositary Shares (ARM) vs competitors — business, growth, and fundamentals comparison against the closest industry rivals.
Get notified when ARM posts new earnings or crosses analyst targets
Free. No account needed. Unsubscribe any time.
Arm Holdings plc American Depositary Shares (ARM) stock FAQ — growth, dividends, profitability & financials explained
Arm Holdings plc American Depositary Shares (ARM) reported $4.92B in revenue for fiscal year 2026. This represents a 82% increase from $2.70B in 2022.
Arm Holdings plc American Depositary Shares (ARM) grew revenue by 22.8% over the past year. This is strong growth.
Yes, Arm Holdings plc American Depositary Shares (ARM) is profitable, generating $904.0M in net income for fiscal year 2026 (18.4% net margin).
Arm Holdings plc American Depositary Shares (ARM) has a return on equity (ROE) of 12.0%. This is reasonable for most industries.
Arm Holdings plc American Depositary Shares (ARM) generated $972.0M in free cash flow for fiscal year 2026. Positive FCF indicates the company can fund dividends, buybacks, or reinvestment.