VCP ScannerFree US Stock Screener & Financial AnalysisFree US Stock Screener
ScreenerThemes
DCF ValuationCalculate intrinsic value of US stocks
Market ValuationBuffett indicator, CAPE & macro gauges
Total ReturnSee dividends + price return history
DCA CalculatorSimulate recurring buys & compounding
Earnings
FAANG & Tech
AAPL vs MSFTNVDA vs AMDGOOGL vs META
Cloud & Cyber
CRM vs NOWCRWD vs PANWSNOW vs DDOG
Consumer & Auto
TSLA vs FAMZN vs WMTNFLX vs DIS
Finance & Crypto
JPM vs BACV vs MACOIN vs MSTR
Pharma & Energy
LLY vs NVOJNJ vs PFEXOM vs CVX
Compare Any Stocks...
WatchlistInsider
ScreenerThemes
Earnings
WatchlistInsider
TSEM
← Back to Screener
VCP ScannerFree US Stock Screener & Financial Analysis

Find stocks. Verify deeply. Act with conviction.

Data updated daily

Product

  • Screener
  • Themes
  • Valuation
  • Total Return
  • DCA Calculator
  • News
  • Earnings

Resources

  • Market Valuation
  • Compare
  • Insider Activity
  • Methodology
  • How It Works
  • Glossary
  • Learn

Get Ideas

Get weekly stock ideas — free

© 2026 VCP Scanner
AboutPrivacyTerms
Not financial advice. Do your own research.
ScreenerNewsCompareWatchlist
TSEMTower Semiconductor Ltd.
$211.93$24.2B
Overview & Verdict
Overview
Valuation & Forecasts
Valuation ModelsEstimatesDCF Model
Price & Analyst Data
Analyst TargetsPrice HistoryTechnical Analysis
Financial Statements
Income StatementBalance SheetCash FlowRatios & Margins
Performance
P/E HistoryRevenue HistoryEarnings HistoryDividend HistoryTotal Return
Ownership
Holders

TSEM logoTower Semiconductor Ltd.(TSEM)Earnings, Financials & Key Ratios

TSEM•NASDAQ
$211.93
109.2× P/E·Price updated Jul 7, 2026
SectorTechnologyIndustrySemiconductorsSub-IndustrySemiconductor Foundries and Manufacturing Services
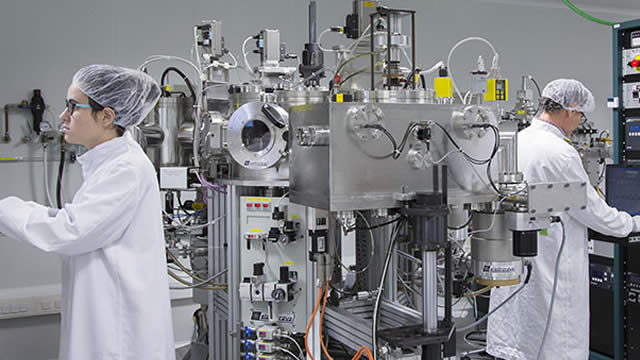
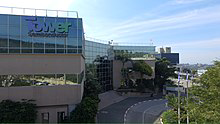
AboutTower Semiconductor Ltd., an independent semiconductor foundry, manufactures and markets analog intensive mixed-signal semiconductor devices in the United States, Japan, other Asia countries, and Europe. It provides various customizable process technologies, including SiGe, BiCMOS, mixed signal/CMOS, RF CMOS, CMOS image sensor, integrated power management, and MEMS. The company also offers wafer fabrication services and design enablement platform for design cycle, as well as transfer optimization and development process services to integrated device manufacturers and fabless companies. It serves various markets, such as consumer electronics, personal computers, communications, automotive, industrial, aerospace, military, and medical device products. The company was incorporated in 1993 and is headquartered in Migdal Haemek, Israel.Show more
  • Revenue$1.57B+9.1%
  • EBITDA$497M+8.7%
  • Net Income$220M+6.1%
  • EPS (Diluted)1.94+4.9%
  • Gross Margin23.23%-1.7%
  • EBITDA Margin31.75%-0.3%
  • Operating Margin12.4%-6.9%
  • Net Margin14.08%-2.7%
  • ROE7.95%-3.1%

TSEM Price & Volume

Tower Semiconductor Ltd. (TSEM) stock price & volume — 10-year historical chart

Loading chart...

Specialized Foundry Scaling Amidst Regional Operational Risks

Investment Thesis • Updated 2026Q1

VerdictNeutral
Growth:Accelerating
Profitability:Moderate
Financial:Fortress
Cash Flow:Robust
Primary Risk:Regional geopolitical instability

Key Thesis Takeaways

  • Tower Semiconductor is successfully scaling its specialized analog foundry operations, evidenced by a 15.5% year-over-year revenue growth in 2026Q1 and a robust balance sheet with a 0.05 debt-to-equity ratio.
  • While the company demonstrates improved operating leverage, investors should monitor the inherent volatility in free cash flow, which swung from a negative $75.3 million in 2025Q4 to a positive $353.6 million in 2026Q1.
  • The long-term outlook remains tempered by significant geopolitical risks associated with its regional manufacturing footprint and the high capital intensity required to maintain competitive process nodes.

Verdict Logic

while the company maintains a strong current ratio of 5.63, the current P/E of 128.82 and significant geopolitical exposure warrant a cautious approach until cash flow consistency improves.

TSEM Growth Metrics

Tower Semiconductor Ltd. (TSEM) revenue, earnings & EPS growth — 3, 5 & 10-year CAGR

Revenue CAGR

10 Years5.01%
5 Years4.35%
3 Years-2.27%
TTM10.53%

Profit CAGR

10 Years-
5 Years21.78%
3 Years-5.9%
TTM20.65%

EPS CAGR

10 Years-
5 Years20.61%
3 Years-6.72%
TTM18.78%

Return on Capital

10 Years11.75%
5 Years12.09%
3 Years12.15%
Last Year6.63%

TSEM Recent Earnings

Tower Semiconductor Ltd. (TSEM) EPS & revenue vs analyst estimates — last 4 quarters

Full history →
●Beat EPS 11/12 qtrs (92%)●Beat Revenue 8/12 qtrs (67%)
Q2 2026Latest
May 13, 2026
Metric
Actual
Est
EPS
$0.65+15.5%
$0.56
Rev
$414M+0.7%
$411M
Q1 2026
Feb 11, 2026
Metric
Actual
Est
EPS
$0.78+16.4%
$0.67
Rev
$440M+0.1%
$440M
Q4 2025
Nov 10, 2025
Metric
Actual
Est
EPS
$0.55+1.3%
$0.54
Rev
$396M+0.2%
$395M
Q3 2025
Aug 4, 2025
Metric
Actual
Est
EPS
$0.50+6.4%
$0.47
Rev
$372M-5.8%
$395M
QuarterDateEPS (Act vs Est)Revenue (Act vs Est)
Q2 2026LatestMay 13, 2026
$0.65vs $0.56+15.5%
$414Mvs $411M+0.7%
Q1 2026Feb 11, 2026
$0.78vs $0.67+16.4%
$440Mvs $440M+0.1%
Q4 2025Nov 10, 2025
$0.55vs $0.54+1.3%
$396Mvs $395M+0.2%
Q3 2025Aug 4, 2025
$0.50vs $0.47+6.4%
$372Mvs $395M-5.8%
Based on last 12 quarters of dataView full earnings history →

Latest TSEM News

Recent stock market news and headlines for Tower Semiconductor Ltd. (TSEM)

The Motley Fool·Jun 26, 2026
Why Tower Semiconductor Took a Dive Today

Tower Semiconductor fell along with many AI chip stocks. The New York Times reported yesterday that OpenAI may delay its IPO.

GlobeNewsWire·Jun 18, 2026
Tower Semiconductor and Marvell Ship Over Five Million Coherent Photonic ICs

Tower's advanced silicon photonics platform enables high-bandwidth, energy-efficient data center connectivity

Globe News Wire·Jun 18, 2026
Tower Semiconductor and Marvell Ship Over Five Million Coherent Photonic ICs

Tower's advanced silicon photonics platform enables high-bandwidth, energy-efficient data center connectivity MIGDAL HAEMEK, Israel, June 18, 2026 - Tower Semiconductor (NASDAQ/TASE: TSEM), the leading foundry for high-value analog semiconductor solutions, today announced a significant milestone. The company, in partnership with Marvell Technology, has shipped over five million coherent photonic integrated circuits (PICs) to Marvell global customers, delivering advanced, high-performance photonics solutions to address the growing bandwidth and efficiency demands of AI-driven data center interconnect (DCI) networks.
Proactive Investors·Jun 15, 2026
Tower Semiconductor shares jump on IQE supply deal

Tower Semiconductor (NASDAQ:TSEM) shares surged nearly 9% after the company signed a multi-year indium phosphide epiwafer supply agreement with IQE, targeting the fast-growing AI data center optical connectivity market. Under the deal, IQE will supply InP epiwafers to support Tower's advanced silicon photonics platforms, including 200Gbps/lane pluggable transceivers and prototyping of 400Gbps/lane modulators, as well as optical circuit switches.

GuruFocus·Jun 15, 2026
Tower Semiconductor Secures Multi-Year Agreement with IQE to Boost Growth

Tower Semiconductor (TSEM) has seen its stock surge following the announcement of a multi-year agreement with IQE. This partnership focuses on supplying Indium
Peers Comparison

Key metrics vs top competitors for Tower Semiconductor Ltd. (TSEM)

Full Screener →
CompanyPriceMarket CapP/E RatioRev Growth (1Y)Net MarginROEDiv Yield
TSEM logoTSEMTower Semiconductor Ltd.Current
$211.93$24.23B109.249.05%14.08%7.95%—
GFS logoGFSGLOBALFOUNDRIES Inc.
$65.84$36.11B41.410.61%11.37%6.63%—
UMC logoUMCUnited Microelectronics Corporation
$23.83$59.44B45.872.26%20.82%13.5%—
INTC logoINTCIntel Corporation
$110.39$554.27B-1874.19-0.47%-5.9%-2.68%—
ON logoONON Semiconductor Corporation
$91.10$35.7B314.14-15.35%9.46%7.43%—
WOLF logoWOLFWolfspeed, Inc.
$36.00$1.62B-1.05-6.14%-222.23%-5208.55%—

Compare TSEM vs Peers

Tower Semiconductor Ltd. (TSEM) vs competitors — business, growth, and fundamentals comparison against the closest industry rivals.

Closest Rival

vs GFS

Most directly comparable listed peer for TSEM.

Scale Benchmark

vs INTC

Larger-name benchmark to compare TSEM against a more recognizable public peer.

Peer Set

Compare Top 5

vs GFS, UMC, INTC, ON

Get notified when TSEM posts new earnings or crosses analyst targets

Free. No account needed. Unsubscribe any time.

Free. Unsubscribe any time.

TSEM Frequently Asked Questions

Tower Semiconductor Ltd. (TSEM) stock FAQ — growth, dividends, profitability & financials explained

Growth & Financials
What is Tower Semiconductor Ltd.'s revenue?

Tower Semiconductor Ltd. (TSEM) reported $1.62B in revenue for fiscal year 2025. This represents a 1556% increase from $97.9M in 1996.

How fast is Tower Semiconductor Ltd. growing?

Tower Semiconductor Ltd. (TSEM) grew revenue by 9.1% over the past year. This is steady growth.

Is TSEM profitable?

Yes, Tower Semiconductor Ltd. (TSEM) is profitable, generating $245.4M in net income for fiscal year 2025 (14.1% net margin).

Dividend & Returns
What is TSEM's return on equity?

Tower Semiconductor Ltd. (TSEM) has a return on equity (ROE) of 8.0%. This is below average, suggesting room for improvement.

What is Tower Semiconductor Ltd.'s free cash flow?

Tower Semiconductor Ltd. (TSEM) generated $326.1M in free cash flow for fiscal year 2025. Positive FCF indicates the company can fund dividends, buybacks, or reinvestment.


What if you invested $1,000 in TSEM back in 1996?

Total return calculator · dividends reinvested · 30+ years of data

See returns →