VCP ScannerFree US Stock Screener & Financial AnalysisFree US Stock Screener
ScreenerThemes
DCF ValuationCalculate intrinsic value of US stocks
Market ValuationBuffett indicator, CAPE & macro gauges
Total ReturnSee dividends + price return history
DCA CalculatorSimulate recurring buys & compounding
Earnings
FAANG & Tech
AAPL vs MSFTNVDA vs AMDGOOGL vs META
Cloud & Cyber
CRM vs NOWCRWD vs PANWSNOW vs DDOG
Consumer & Auto
TSLA vs FAMZN vs WMTNFLX vs DIS
Finance & Crypto
JPM vs BACV vs MACOIN vs MSTR
Pharma & Energy
LLY vs NVOJNJ vs PFEXOM vs CVX
Compare Any Stocks...
WatchlistInsider
ScreenerThemes
Earnings
WatchlistInsider
HPQ
← Back to Screener
VCP ScannerFree US Stock Screener & Financial Analysis

Find stocks. Verify deeply. Act with conviction.

Data updated daily

Product

  • Screener
  • Themes
  • Valuation
  • Total Return
  • DCA Calculator
  • News
  • Earnings

Resources

  • Market Valuation
  • Compare
  • Insider Activity
  • Methodology
  • How It Works
  • Glossary
  • Learn

Get Ideas

Get weekly stock ideas — free

© 2026 VCP Scanner
AboutPrivacyTerms
Not financial advice. Do your own research.
ScreenerNewsCompareWatchlist
HPQHP Inc.
$22.60$20.7B
Overview & Verdict
Overview
Valuation & Forecasts
Valuation ModelsEstimatesDCF Model
Price & Analyst Data
Analyst TargetsPrice HistoryTechnical Analysis
Financial Statements
Income StatementBalance SheetCash FlowRatios & Margins
Performance
P/E HistoryRevenue HistoryEarnings HistoryDividend HistoryTotal Return
Ownership
Holders

HPQ logoHP Inc.(HPQ)Earnings, Financials & Key Ratios

HPQ•NYSE
$22.60
8.5× P/E·Price updated Jul 6, 2026
SectorTechnologyIndustryComputer HardwareSub-IndustryPCs, Workstations and Printing
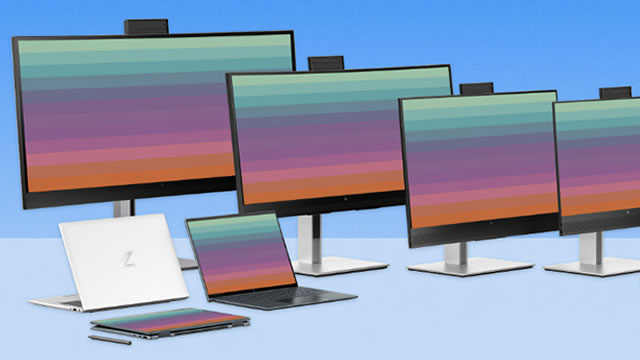
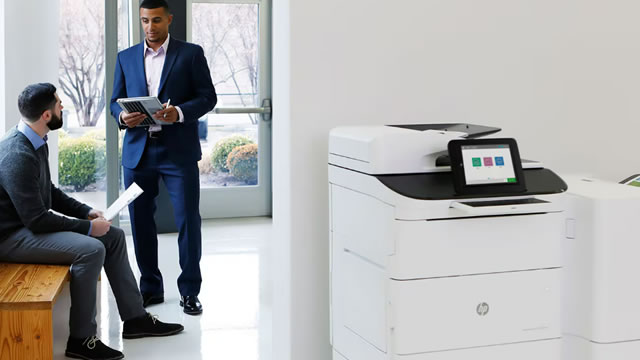
AboutHP Inc. provides personal computing and other access devices, imaging and printing products, and related technologies, solutions, and services in the United States and internationally. The company operates through three segments: Personal Systems, Printing, and Corporate Investments. The Personal Systems segment offers commercial and consumer desktop and notebook personal computers, workstations, thin clients, commercial mobility devices, retail point-of-sale systems, displays and peripherals, software, support, and services. The Printing segment provides consumer and commercial printer hardware, supplies, solutions, and services. The Corporate Investments segment is involved in the HP Labs and business incubation, and investment projects. It serves individual consumers, small- and medium-sized businesses, and large enterprises, including customers in the government, health, and education sectors. The company was formerly known as Hewlett-Packard Company and changed its name to HP Inc. in October 2015. HP Inc. was founded in 1939 and is headquartered in Palo Alto, California.Show more
  • Revenue$55.3B+3.2%
  • EBITDA$4.54B-2.3%
  • Net Income$2.53B-8.9%
  • EPS (Diluted)2.65-5.7%
  • Gross Margin19.98%-9.5%
  • EBITDA Margin8.21%-5.4%
  • Operating Margin6.55%-8.1%
  • Net Margin4.57%-11.7%

HPQ Price & Volume

HP Inc. (HPQ) stock price & volume — 10-year historical chart

Loading chart...

Cyclical Revenue Recovery Faces Structural Margin Headwinds

Investment Thesis • Updated 2026Q2

VerdictNeutral
Growth:Accelerating
Profitability:Strained
Financial:Vulnerable
Cash Flow:Mixed
Primary Risk:Negative equity and leverage

Key Thesis Takeaways

  • HPQ exhibits a complex fundamental profile where recent revenue growth acceleration to 9.0% in 2026Q2 is offset by persistent structural margin compression and a precarious balance sheet.
  • While the company maintains a 5.0% dividend yield, the reliance on aggressive capital returns has resulted in a negative equity position of $144 million as of 2026Q2.
  • Investors should monitor whether the core printing segment's eroding gross margins can stabilize or if the current capital allocation strategy continues to impair long-term financial flexibility.

Verdict Logic

while the forward P/E of 7.57 appears attractive, the combination of a negative equity position and the erosion of gross margins from 23.6% in 2024Q2 to 20.9% in 2026Q2 warrants a cautious stance.

HPQ Growth Metrics

HP Inc. (HPQ) revenue, earnings & EPS growth — 3, 5 & 10-year CAGR

Revenue CAGR

10 Years0.72%
5 Years-0.48%
3 Years-4.21%
TTM5.74%

Profit CAGR

10 Years-5.71%
5 Years-2.12%
3 Years-6.88%
TTM1.43%

EPS CAGR

10 Years0.67%
5 Years5.79%
3 Years-3.84%
TTM5.04%

Return on Capital

10 Years35.76%
5 Years38.4%
3 Years30.19%
Last Year30.54%

HPQ Recent Earnings

HP Inc. (HPQ) EPS & revenue vs analyst estimates — last 4 quarters

Full history →
●Beat EPS 5/12 qtrs (42%)●Beat Revenue 10/12 qtrs (83%)
Q2 2026Latest
May 27, 2026
Metric
Actual
Est
EPS
$0.86+21.0%
$0.71
Rev
$14.4B+3.0%
$14.0B
Q1 2026
Feb 24, 2026
Metric
Actual
Est
EPS
$0.81+5.9%
$0.77
Rev
$14.4B+3.6%
$13.9B
Q4 2025
Nov 25, 2025
Metric
Actual
Est
EPS
$0.93+1.0%
$0.92
Rev
$14.6B+1.0%
$14.5B
Q3 2025
Aug 27, 2025
Metric
Actual
Est
EPS
$0.75+0.7%
$0.74
Rev
$13.9B+1.8%
$13.7B
QuarterDateEPS (Act vs Est)Revenue (Act vs Est)
Q2 2026LatestMay 27, 2026
$0.86vs $0.71+21.0%
$14.4Bvs $14.0B+3.0%
Q1 2026Feb 24, 2026
$0.81vs $0.77+5.9%
$14.4Bvs $13.9B+3.6%
Q4 2025Nov 25, 2025
$0.93vs $0.92+1.0%
$14.6Bvs $14.5B+1.0%
Q3 2025Aug 27, 2025
$0.75vs $0.74+0.7%
$13.9Bvs $13.7B+1.8%
Based on last 12 quarters of dataView full earnings history →

Latest HPQ News

Recent stock market news and headlines for HP Inc. (HPQ)

Seeking Alpha·5 days ago
HP Stock Doesn't Deserve To Be So Unloved

HP's business continues to rebound, with Q2 revenues up 9% and three consecutive quarters of accelerating top-line growth. The Personal Systems segment outperformed; the Nvidia RTX Spark chip launch could spark an AI PC upgrade super cycle despite Apple's competitive push. Margins expanded, Q2 adjusted EPS of $0.86 beat expectations, and the stock boasts a 5.47% dividend yield, though debt levels warrant monitoring.

GlobeNewsWire·Jun 28, 2026
HP Inc. Launches Frontier Strategic Partnership with OpenAI to Fuel Customer-Facing Experiences and Transform Internal Operations

News Highlights:  HP Inc. will deploy powerful AI-driven solutions with OpenAI Frontier to help drive HP transformation and growth initiatives  The Frontier platform will be used across HP's business, to enhance customer-facing experiences and internal operations   The Frontier strategic partnership supports HP's efforts to deliver an advanced telemetry platform with WXP, a recognized Gartner magic quadrant leader, enabling a connected device layer for the AI era  PALO ALTO, Calif., June 28, 2026 (GLOBE NEWSWIRE) -- Today, HP Inc. (NYSE: HPQ) announced the launch of a strategic partnership with OpenAI, integrating its Frontier platform into HP's global efforts to shape the Future of Work through enhanced customer-facing experiences and accelerated transformation across its operations.

Zacks Investment Research·Jun 26, 2026
Why Is HP (HPQ) Down 8.4% Since Last Earnings Report?

HP (HPQ) reported earnings 30 days ago. What's next for the stock?

PRNewsWire·Jun 17, 2026
HPQ Signs LOI to Evaluate Development of a Canadian-Based Electric Propulsion Platform for North American Markets

HPQ signed an LOI with LN Innov' and Novacium SAS to evaluate a Canadian-based platform integrating advanced batteries, electric motors and propulsion systems for North American drone and defense markets. HPQ has direct exposure to the proposed platform through their 36.8% equity interest in Novacium SAS and exclusive North American commercialization rights.

GlobeNewsWire·Jun 16, 2026
HP Inc. Declares Dividend

PALO ALTO, Calif., June 16, 2026 (GLOBE NEWSWIRE) -- HP Inc. (NYSE: HPQ) has declared a cash dividend of $0.3000 per share on the company's common stock.

Peers Comparison

Key metrics vs top competitors for HP Inc. (HPQ)

Full Screener →
CompanyPriceMarket CapP/E RatioRev Growth (1Y)Net MarginROEDiv Yield
HPQ logoHPQHP Inc.Current
$22.60$20.67B8.533.24%4.57%—5.05%
DELL logoDELLDell Technologies Inc.
$411.51$273.34B47.4118.8%6.28%——
AAPL logoAAPLApple Inc.
$312.66$4.59T41.916.43%27.15%146.69%—
MSFT logoMSFTMicrosoft Corporation
$386.74$2.87T28.3514.93%39.34%33.13%—
XRX logoXRXXerox Holdings Corporation
$2.88$376.63M-0.3512.88%-14.09%-142.38%—
INTC logoINTCIntel Corporation
$122.20$613.57B-2074.70-0.47%-5.9%-2.68%—

Compare HPQ vs Peers

HP Inc. (HPQ) vs competitors — business, growth, and fundamentals comparison against the closest industry rivals.

Closest Rival

vs DELL

Most directly comparable listed peer for HPQ.

Scale Benchmark

vs NVDA

Larger-name benchmark to compare HPQ against a more recognizable public peer.

Peer Set

Compare Top 5

vs DELL, AAPL, MSFT, XRX

HPQ SEC Filings & Documents

HP Inc. (HPQ) SEC filings — annual & quarterly reports (10-K, 10-Q)

8-K Announcements

6
Material company update

May 27, 2026·SEC

Material company update

Apr 21, 2026·SEC

Material company update

Feb 24, 2026·SEC

10-K Annual Reports

3
FY 2025

Dec 10, 2025·SEC

FY 2024

Dec 13, 2024·SEC

FY 2023

Dec 18, 2023·SEC

10-Q Quarterly Reports

6
FY 2026

May 28, 2026·SEC

FY 2026

Feb 25, 2026·SEC

FY 2025

Aug 28, 2025·SEC

Get notified when HPQ posts new earnings or crosses analyst targets

Free. No account needed. Unsubscribe any time.

Free. Unsubscribe any time.

HPQ Frequently Asked Questions

HP Inc. (HPQ) stock FAQ — growth, dividends, profitability & financials explained

Growth & Financials
What is HP Inc.'s revenue?

HP Inc. (HPQ) reported $57.42B in revenue for fiscal year 2025. This represents a 49% increase from $38.42B in 1996.

How fast is HP Inc. growing?

HP Inc. (HPQ) grew revenue by 3.2% over the past year. Growth has been modest.

Is HPQ profitable?

Yes, HP Inc. (HPQ) is profitable, generating $2.55B in net income for fiscal year 2025 (4.6% net margin).

Dividend & Returns
Does HPQ pay dividends?

Yes, HP Inc. (HPQ) pays a dividend with a yield of 5.05%. This makes it attractive for income-focused investors.

What is HP Inc.'s free cash flow?

HP Inc. (HPQ) generated $3.78B in free cash flow for fiscal year 2025. Positive FCF indicates the company can fund dividends, buybacks, or reinvestment.

What if you invested $1,000 in HPQ back in 1996?

Total return calculator · dividends reinvested · 30+ years of data

See returns →