VCP ScannerFree US Stock Screener & Financial AnalysisFree US Stock Screener
ScreenerThemes
DCF ValuationCalculate intrinsic value of US stocks
Market ValuationBuffett indicator, CAPE & macro gauges
Total ReturnSee dividends + price return history
DCA CalculatorSimulate recurring buys & compounding
Earnings
FAANG & Tech
AAPL vs MSFTNVDA vs AMDGOOGL vs META
Cloud & Cyber
CRM vs NOWCRWD vs PANWSNOW vs DDOG
Consumer & Auto
TSLA vs FAMZN vs WMTNFLX vs DIS
Finance & Crypto
JPM vs BACV vs MACOIN vs MSTR
Pharma & Energy
LLY vs NVOJNJ vs PFEXOM vs CVX
Compare Any Stocks...
WatchlistInsider
ScreenerThemes
Earnings
WatchlistInsider
HII
← Back to Screener
VCP ScannerFree US Stock Screener & Financial Analysis

Find stocks. Verify deeply. Act with conviction.

Data updated daily

Product

  • Screener
  • Themes
  • Valuation
  • Total Return
  • DCA Calculator
  • News
  • Earnings

Resources

  • Market Valuation
  • Compare
  • Insider Activity
  • Methodology
  • How It Works
  • Glossary
  • Learn

Get Ideas

Get weekly stock ideas — free

© 2026 VCP Scanner
AboutPrivacyTerms
Not financial advice. Do your own research.
ScreenerNewsCompareWatchlist
HIIHuntington Ingalls Industries, Inc.
$289.46$11.4B
Overview & Verdict
Overview
Valuation & Forecasts
Valuation ModelsEstimatesDCF Model
Price & Analyst Data
Analyst TargetsPrice HistoryTechnical Analysis
Financial Statements
Income StatementBalance SheetCash FlowRatios & Margins
Performance
P/E HistoryRevenue HistoryEarnings HistoryDividend HistoryTotal Return
Ownership
Holders

HII logoHuntington Ingalls Industries, Inc.(HII)Earnings, Financials & Key Ratios

HII•NYSE
$294.10
19.1× P/E·Price updated Jul 6, 2026
SectorIndustrialsIndustryAerospace & DefenseSub-IndustryNaval Shipbuilding and Systems
AboutHuntington Ingalls Industries, Inc. engages in designing, building, overhauling, and repairing military ships in the United States. It operates through three segments: Ingalls Shipbuilding, Newport News Shipbuilding, and Technical Solutions. The company is involved in the design and construction of non-nuclear ships comprising amphibious assault ships; expeditionary warfare ships; surface combatants; and national security cutters for the U.S. Navy and U.S. Coast Guard. It also provides nuclear-powered ships, such as aircraft carriers and submarines, as well as refueling and overhaul, and inactivation services of ships. In addition, the company offers naval nuclear support services, including fleet services comprising design, construction, maintenance, and disposal activities for in-service the U.S. Navy nuclear ships; and maintenance services on nuclear reactor prototypes. Further, it provides life-cycle sustainment services to the U.S. Navy fleet and other maritime customers; high-end information technology and mission-based solutions for Department of Defense (DoD), intelligence, and federal civilian customers; nuclear management and operations and environmental management services for the Department of Energy, DoD, state and local governments, and private sector companies; defense and federal solutions; and unmanned systems. Huntington Ingalls Industries, Inc. was founded in 1886 and is headquartered in Newport News, Virginia.Show more
  • Revenue$12.48B+8.2%
  • EBITDA$937M+8.8%
  • Net Income$605M+10.0%
  • EPS (Diluted)15.39+10.2%
  • Gross Margin12.7%+1.0%
  • EBITDA Margin7.51%+0.6%
  • Operating Margin4.87%+5.0%
  • Net Margin4.85%+1.6%
  • ROE12.42%-1.1%

HII Price & Volume

Huntington Ingalls Industries, Inc. (HII) stock price & volume — 10-year historical chart

Loading chart...

Shipbuilding Cyclicality Masks Underlying Margin Execution Risks

Investment Thesis • Updated 2026Q1

VerdictNeutral
Growth:Mixed
Profitability:Strained
Financial:Healthy
Cash Flow:Mixed
Primary Risk:Operational Execution and Labor

Key Thesis Takeaways

  • Huntington Ingalls Industries maintains a critical role in U.S.
  • naval defense, yet its financial performance remains tethered to the inherent lumpiness of long-term shipbuilding contracts and persistent labor-related cost pressures.
  • While the company benefits from a conservative capital structure with a debt-to-equity ratio consistently below 0.75, investors should monitor the volatility in operating margins, which have struggled to exceed 6.3% over the last ten quarters.
  • Future value creation depends on the company's ability to stabilize its percentage-of-completion accounting and mitigate the operational risks that have led to significant quarterly free cash flow swings, such as the $464 million outflow observed in 2026Q1.

Verdict Logic

while the company maintains a stable dividend payout, the current P/E of 18.32 and the significant volatility in quarterly free cash flow suggest that investors should wait for more consistent margin expansion before increasing exposure.

HII Growth Metrics

Huntington Ingalls Industries, Inc. (HII) revenue, earnings & EPS growth — 3, 5 & 10-year CAGR

Revenue CAGR

10 Years5.93%
5 Years5.93%
3 Years5.35%
TTM12.08%

Profit CAGR

10 Years4.12%
5 Years-2.76%
3 Years1.47%
TTM10.81%

EPS CAGR

10 Years6.29%
5 Years-2.13%
3 Years2.15%
TTM10.73%

Return on Capital

10 Years11.96%
5 Years7.31%
3 Years7.43%
Last Year6.45%

HII Recent Earnings

Huntington Ingalls Industries, Inc. (HII) EPS & revenue vs analyst estimates — last 4 quarters

Full history →
●Beat EPS 10/12 qtrs (83%)●Beat Revenue 10/12 qtrs (83%)
Q2 2026Latest
May 5, 2026
Metric
Actual
Est
EPS
$3.79+2.4%
$3.70
Rev
$3.1B+2.6%
$3.0B
Q1 2026
Feb 5, 2026
Metric
Actual
Est
EPS
$4.04+8.6%
$3.72
Rev
$3.5B+12.5%
$3.1B
Q4 2025
Oct 30, 2025
Metric
Actual
Est
EPS
$3.68+11.5%
$3.30
Rev
$3.2B+8.0%
$3.0B
Q3 2025
Jul 31, 2025
Metric
Actual
Est
EPS
$3.86+19.5%
$3.23
Rev
$3.1B+4.4%
$3.0B
QuarterDateEPS (Act vs Est)Revenue (Act vs Est)
Q2 2026LatestMay 5, 2026
$3.79vs $3.70+2.4%
$3.1Bvs $3.0B+2.6%
Q1 2026Feb 5, 2026
$4.04vs $3.72+8.6%
$3.5Bvs $3.1B+12.5%
Q4 2025Oct 30, 2025
$3.68vs $3.30+11.5%
$3.2Bvs $3.0B+8.0%
Q3 2025Jul 31, 2025
$3.86vs $3.23+19.5%
$3.1Bvs $3.0B+4.4%
Based on last 12 quarters of dataView full earnings history →

Latest HII News

Recent stock market news and headlines for Huntington Ingalls Industries, Inc. (HII)

GlobeNewsWire·6 days ago
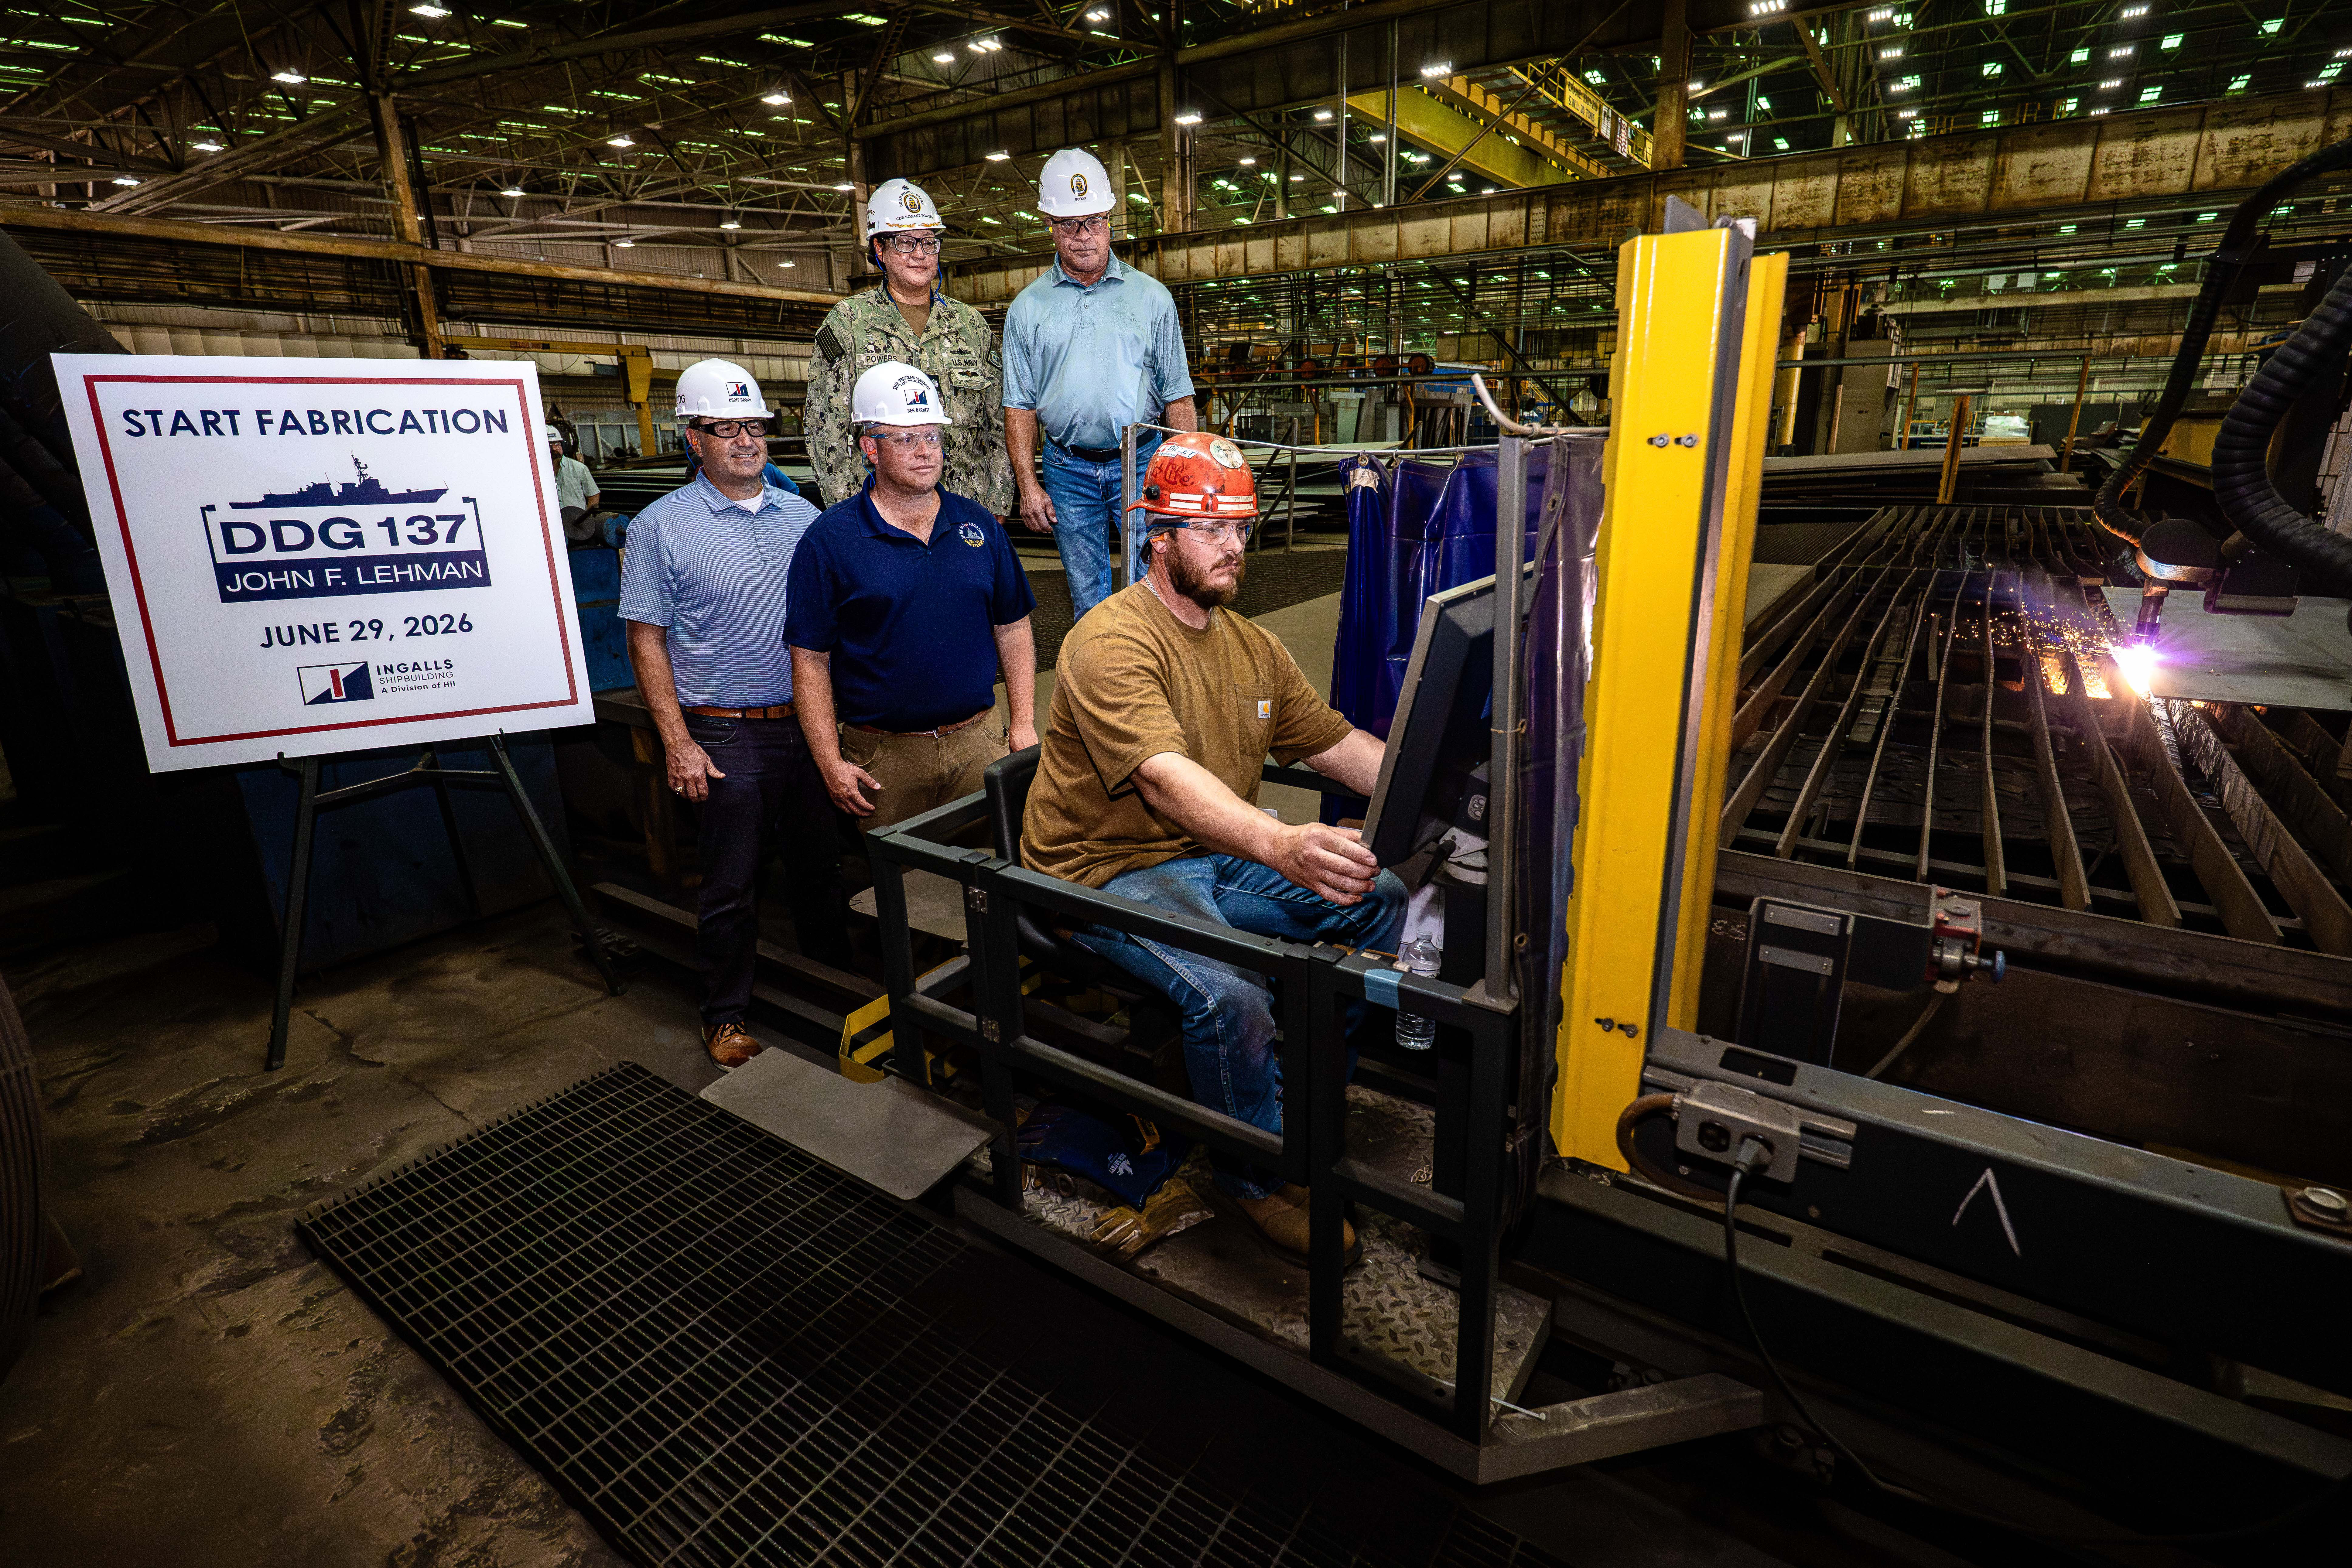
HII Begins Fabrication of Destroyer John F. Lehman (DDG 137)

PASCAGOULA, Miss., July 01, 2026 (GLOBE NEWSWIRE) -- HII's (NYSE: HII) Ingalls Shipbuilding division began fabrication of the future USS John F. Lehman (DDG 137) Monday, marking the official start of construction on the Navy's newest Flight III Arleigh Burke‑class destroyer.

Globe News Wire·6 days ago
HII Begins Fabrication of Destroyer John F. Lehman (DDG 137)

PASCAGOULA, Miss. , July 01, 2026 (GLOBE NEWSWIRE) -- HII's (NYSE: HII) Ingalls Shipbuilding division began fabrication of the future USS John F. Lehman (DDG 137) Monday, marking the official start of construction on the Navy's newest Flight III Arleigh Burke‑class destroyer.

Zacks Investment Research·6 days ago
Is HII Expanding Its Presence in the Naval Sustainment Market?

Huntington Ingalls Industries' Navy contract, sustainment expertise and modernization support are strengthening its role in the naval sustainment market.

Zacks Investment Research·Jun 30, 2026
Here's Why Huntington Ingalls (HII) is a Strong Value Stock

Wondering how to pick strong, market-beating stocks for your investment portfolio? Look no further than the Zacks Style Scores.

The Motley Fool·Jun 28, 2026
Huntington Ingalls Industries vs. Lockheed Martin: Which Industrial Stock Is a Better Buy in 2026?

Huntington Ingalls Industries is the primary shipbuilder for the U.S. Navy, maintaining a dominant position in aircraft carrier and submarine construction. Lockheed Martin offers vast diversification across aerospace, missiles, and space technology, anchored by the massive F-35 fighter jet program.

Peers Comparison

Key metrics vs top competitors for Huntington Ingalls Industries, Inc. (HII)

Full Screener →
CompanyPriceMarket CapP/E RatioRev Growth (1Y)Net MarginROEDiv Yield
HII logoHIIHuntington Ingalls Industries, Inc.Current
$294.10$11.58B19.118.23%4.85%12.42%1.84%
GD logoGDGeneral Dynamics Corporation
$376.88$101.92B24.3810.13%8.07%17.41%—
LMT logoLMTLockheed Martin Corporation
$538.00$123.99B25.035.65%6.38%74.53%—
NOC logoNOCNorthrop Grumman Corporation
$547.75$77.8B18.842.24%10.8%28.05%—
RTX logoRTXRTX Corporation
$201.37$271.18B40.609.74%8.03%10.92%—
BA logoBAThe Boeing Company
$234.54$184.89B94.5734.49%2.46%——

Compare HII vs Peers

Huntington Ingalls Industries, Inc. (HII) vs competitors — business, growth, and fundamentals comparison against the closest industry rivals.

Closest Rival

vs GD

Most directly comparable listed peer for HII.

Scale Benchmark

vs GE

Larger-name benchmark to compare HII against a more recognizable public peer.

Peer Set

Compare Top 5

vs GD, LMT, NOC, RTX

HII SEC Filings & Documents

Huntington Ingalls Industries, Inc. (HII) SEC filings — annual & quarterly reports (10-K, 10-Q)

8-K Announcements

6
Material company update

May 5, 2026·SEC

Material company update

May 1, 2026·SEC

Material company update

Feb 5, 2026·SEC

10-K Annual Reports

1
FY 2026

Feb 5, 2026·SEC

10-Q Quarterly Reports

4
FY 2026

May 5, 2026·SEC

FY 2025

Oct 30, 2025·SEC

FY 2025

Jul 31, 2025·SEC

Get notified when HII posts new earnings or crosses analyst targets

Free. No account needed. Unsubscribe any time.

Free. Unsubscribe any time.

HII Frequently Asked Questions

Huntington Ingalls Industries, Inc. (HII) stock FAQ — growth, dividends, profitability & financials explained

Growth & Financials
What is Huntington Ingalls Industries, Inc.'s revenue?

Huntington Ingalls Industries, Inc. (HII) reported $12.85B in revenue for fiscal year 2025. This represents a 91% increase from $6.72B in 2010.

How fast is Huntington Ingalls Industries, Inc. growing?

Huntington Ingalls Industries, Inc. (HII) grew revenue by 8.2% over the past year. This is steady growth.

Is HII profitable?

Yes, Huntington Ingalls Industries, Inc. (HII) is profitable, generating $605.0M in net income for fiscal year 2025 (4.8% net margin).

Dividend & Returns
Does HII pay dividends?

Yes, Huntington Ingalls Industries, Inc. (HII) pays a dividend with a yield of 1.84%. This makes it attractive for income-focused investors.

What is HII's return on equity?

Huntington Ingalls Industries, Inc. (HII) has a return on equity (ROE) of 12.4%. This is reasonable for most industries.

What is Huntington Ingalls Industries, Inc.'s free cash flow?

Huntington Ingalls Industries, Inc. (HII) generated $1.06B in free cash flow for fiscal year 2025. Positive FCF indicates the company can fund dividends, buybacks, or reinvestment.

What if you invested $1,000 in HII back in 2010?

Total return calculator · dividends reinvested · 16+ years of data

See returns →