Zacks Investment Research·5 days ago
Freeport-McMoRan (FCX) Suffers a Larger Drop Than the General Market: Key InsightsFreeport-McMoRan (FCX) closed at $60.53 in the latest trading session, marking a -3.75% move from the prior day.
 Freeport-McMoRan Inc.(FCX)Earnings, Financials & Key Ratios
Freeport-McMoRan Inc. (FCX) stock price & volume — 10-year historical chart
Investment Thesis • Updated 2026Q1
while the balance sheet is exceptionally strong with a debt-to-equity ratio of 0.02 as of 2026Q1, the current P/E of 41.01 and the inherent geopolitical risks in Indonesia warrant a cautious approach until further margin stability is demonstrated.
Freeport-McMoRan Inc. (FCX) revenue, earnings & EPS growth — 3, 5 & 10-year CAGR
Freeport-McMoRan Inc. (FCX) EPS & revenue vs analyst estimates — last 4 quarters
| Quarter | Date | EPS (Act vs Est) | Revenue (Act vs Est) |
|---|---|---|---|
| Q2 2026Latest | Apr 23, 2026 | $0.57vs $0.47+22.2% | $6.2Bvs $5.7B+8.8% |
| Q1 2026 | Jan 22, 2026 | $0.47vs $0.29+64.8% | $5.6Bvs $5.3B+6.4% |
| Q4 2025 | Oct 23, 2025 | $0.50vs $0.42+18.7% | $7.0Bvs $6.7B+3.9% |
| Q3 2025 | Jul 23, 2025 | $0.54vs $0.45+20.1% | $7.6Bvs $7.2B+5.5% |
Recent stock market news and headlines for Freeport-McMoRan Inc. (FCX)
Freeport-McMoRan (FCX) closed at $60.53 in the latest trading session, marking a -3.75% move from the prior day.
Southern Copper (NYSE:SCCO | SCCO Price Prediction) is the name on every commodity desk's lips right now, with the stock up 73.95% over the past year on the back of a screaming copper tape.
The United States Oil Fund (NYSEARCA:USO) does one thing: it gives investors a liquid way to bet on West Texas Intermediate crude without opening a futures account.

FCX advances major expansion projects, lifting copper capacity and output as its organic pipeline targets the next growth phase.
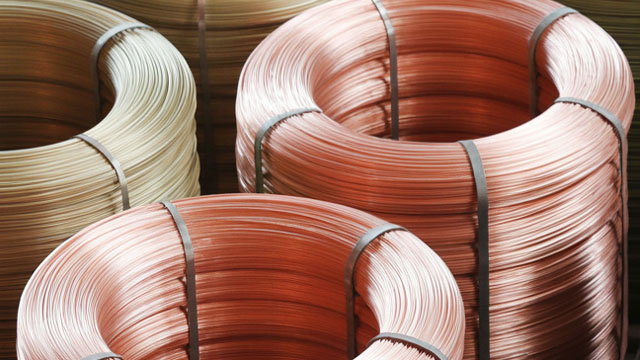
In the closing of the recent trading day, Freeport-McMoRan (FCX) stood at $62.8, denoting a +1.55% move from the preceding trading day.
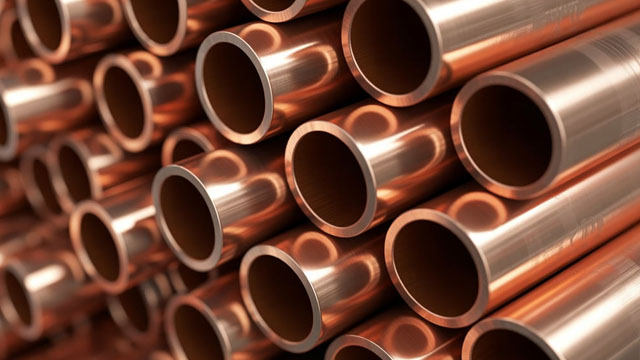
Key metrics vs top competitors for Freeport-McMoRan Inc. (FCX)
| Company | Price | Market Cap | P/E Ratio | Rev Growth (1Y) | Net Margin | ROE | Div Yield |
|---|---|---|---|---|---|---|---|
| $60.55 | $87.02B | 39.84 | 1.12% | 8.56% | 7.4% | 0.99% | |
| $168.80 | $140.83B | 32.21 | 17.38% | 34.16% | 45.67% | — | |
| $59.35 | $28.58B | 29.83 | 18.56% | 14.91% | 7.09% | — | |
| $47.48 | $12.53B | 10.69 | 5.31% | 8.17% | 16.06% | — | |
| $22.59 | $8.97B | 15.47 | 9.39% | 27.74% | 19.99% | — | |
| $19.25 | $371.78M | 6.80 | 38.86% | 22.67% | 22.18% | — |
Freeport-McMoRan Inc. (FCX) vs competitors — business, growth, and fundamentals comparison against the closest industry rivals.
Freeport-McMoRan Inc. (FCX) SEC filings — annual & quarterly reports (10-K, 10-Q)
Apr 23, 2026·SEC
Mar 23, 2026·SEC
Feb 24, 2026·SEC
Get notified when FCX posts new earnings or crosses analyst targets
Free. No account needed. Unsubscribe any time.
Freeport-McMoRan Inc. (FCX) stock FAQ — growth, dividends, profitability & financials explained
Freeport-McMoRan Inc. (FCX) reported $26.42B in revenue for fiscal year 2025. This represents a 1287% increase from $1.91B in 1996.
Freeport-McMoRan Inc. (FCX) grew revenue by 1.1% over the past year. Growth has been modest.
Yes, Freeport-McMoRan Inc. (FCX) is profitable, generating $2.73B in net income for fiscal year 2025 (8.6% net margin).
Yes, Freeport-McMoRan Inc. (FCX) pays a dividend with a yield of 0.99%. This makes it attractive for income-focused investors.
Freeport-McMoRan Inc. (FCX) has a return on equity (ROE) of 7.4%. This is below average, suggesting room for improvement.
Freeport-McMoRan Inc. (FCX) generated $6.25B in free cash flow for fiscal year 2025. Positive FCF indicates the company can fund dividends, buybacks, or reinvestment.