Zacks Investment Research·Jun 25, 2026
Here's Why You Should Buy Valmont Industries Stock Right NowVMI's utility infrastructure demand, strong backlog, capacity expansion and productivity initiatives are supporting growth and margin momentum.
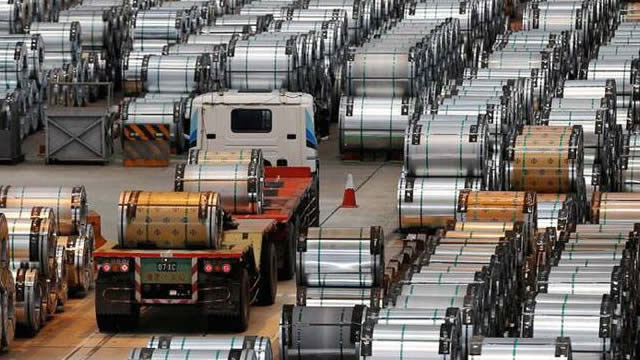
 Valmont Industries, Inc.(VMI)Earnings, Financials & Key Ratios
Valmont Industries, Inc. (VMI) stock price & volume — 10-year historical chart
Investment Thesis • Updated 2026Q1
while the company has reduced debt to $921.3 million, the high P/E ratio of 33.87 and volatile cash flow conversion suggest that the current valuation may not fully account for ongoing cyclical risks.
Valmont Industries, Inc. (VMI) revenue, earnings & EPS growth — 3, 5 & 10-year CAGR
Valmont Industries, Inc. (VMI) EPS & revenue vs analyst estimates — last 4 quarters
| Quarter | Date | EPS (Act vs Est) | Revenue (Act vs Est) |
|---|---|---|---|
| Q2 2026Latest | Apr 21, 2026 | $5.51vs $4.72+16.7% | $1.0Bvs $996M+3.4% |
| Q1 2026 | Feb 17, 2026 | $4.92vs $4.95-0.6% | $1.0Bvs $1.0B-0.5% |
| Q4 2025 | Oct 21, 2025 | $4.98vs $4.64+7.3% | $1.0Bvs $1.0B+0.3% |
| Q3 2025 | Jul 22, 2025 | $4.88vs $4.72+3.4% | $1.1Bvs $1.0B+1.8% |
Recent stock market news and headlines for Valmont Industries, Inc. (VMI)
VMI's utility infrastructure demand, strong backlog, capacity expansion and productivity initiatives are supporting growth and margin momentum.
Wondering how to pick strong, market-beating stocks for your investment portfolio? Look no further than the Zacks Style Scores.
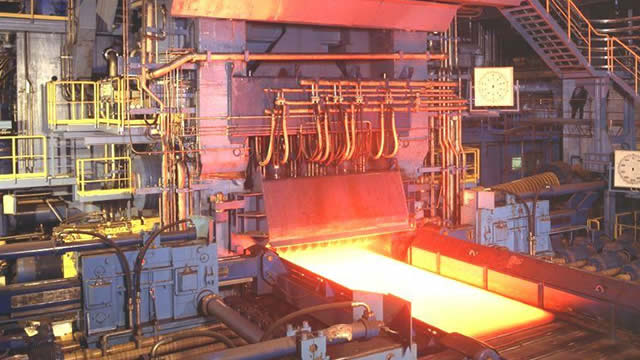
Valmont (VMI) possesses solid growth attributes, which could help it handily outperform the market.
Valmont Industries, Inc. (VMI) Analyst/Investor Day Transcript
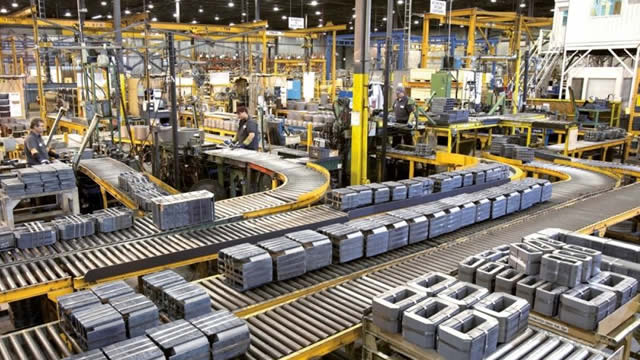
Valmont Industries' rally is backed by Infrastructure margin gains, utility demand, backlog growth and raised fiscal 2026 guidance.
Key metrics vs top competitors for Valmont Industries, Inc. (VMI)
| Company | Price | Market Cap | P/E Ratio | Rev Growth (1Y) | Net Margin | ROE | Div Yield |
|---|---|---|---|---|---|---|---|
| $559.02 | $10.93B | 33.29 | 0.71% | 8.53% | 21.65% | 0.47% | |
| $60.85 | $1.21B | 20.84 | 6.77% | 16.03% | 27.71% | — | |
| $92.94 | $5.04B | 18.51 | 18.97% | 3.31% | 15.21% | — | |
| $463.11 | $7.21B | 61.50 | 8.79% | 3.71% | 22.14% | — | |
| $158.15 | $6.75B | 22.34 | 12.11% | 18.59% | 34.81% | — | |
| $116.42 | $9.54B | 90.25 | 20.11% | 7.3% | 13.4% | — |
Valmont Industries, Inc. (VMI) vs competitors — business, growth, and fundamentals comparison against the closest industry rivals.
Valmont Industries, Inc. (VMI) SEC filings — annual & quarterly reports (10-K, 10-Q)
Apr 21, 2026·SEC
Apr 15, 2026·SEC
Apr 9, 2026·SEC
Get notified when VMI posts new earnings or crosses analyst targets
Free. No account needed. Unsubscribe any time.
Valmont Industries, Inc. (VMI) stock FAQ — growth, dividends, profitability & financials explained
Valmont Industries, Inc. (VMI) reported $4.16B in revenue for fiscal year 2025. This represents a 546% increase from $644.5M in 1996.
Valmont Industries, Inc. (VMI) grew revenue by 0.7% over the past year. Growth has been modest.
Yes, Valmont Industries, Inc. (VMI) is profitable, generating $344.8M in net income for fiscal year 2025 (8.5% net margin).
Yes, Valmont Industries, Inc. (VMI) pays a dividend with a yield of 0.47%. This makes it attractive for income-focused investors.
Valmont Industries, Inc. (VMI) has a return on equity (ROE) of 21.6%. This is excellent, indicating efficient use of shareholder capital.
Valmont Industries, Inc. (VMI) generated $419.5M in free cash flow for fiscal year 2025. Positive FCF indicates the company can fund dividends, buybacks, or reinvestment.