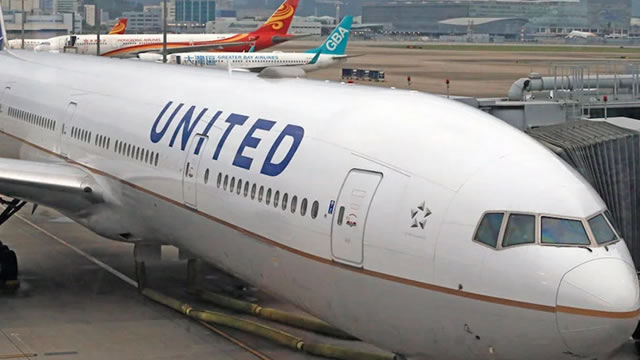
Defense spending is surging while airline profits are under pressure. The choice between these two funds comes down to which story you believe in more.


United Airlines Holdings, Inc. (UAL) stock price & volume — 10-year historical chart
Investment Thesis • Updated 2026Q1
while the company achieved a 21.4% FCF margin in 2026Q1, the structural reliance on operational cash flow to cover short-term obligations and the high debt-to-EBITDA ratio of 17.67 warrant a cautious wait-and-see approach.
United Airlines Holdings, Inc. (UAL) revenue, earnings & EPS growth — 3, 5 & 10-year CAGR
United Airlines Holdings, Inc. (UAL) EPS & revenue vs analyst estimates — last 4 quarters
| Quarter | Date | EPS (Act vs Est) | Revenue (Act vs Est) |
|---|---|---|---|
| Q2 2026Latest | Apr 21, 2026 | $1.19vs $1.08+10.2% | $14.6Bvs $14.4B+1.5% |
| Q1 2026 | Jan 20, 2026 | $3.10vs $2.93+5.8% | $15.4Bvs $15.4B+0.2% |
| Q4 2025 | Oct 15, 2025 | $2.78vs $2.65+4.9% | $15.2Bvs $15.3B-0.7% |
| Q3 2025 | Jul 16, 2025 | $3.87vs $3.81+1.6% | $15.2Bvs $15.4B-0.8% |
Recent stock market news and headlines for United Airlines Holdings, Inc. (UAL)
Defense spending is surging while airline profits are under pressure. The choice between these two funds comes down to which story you believe in more.

Wall Street sent a coordinated bullish signal to the airline sector as Goldman Sachs analyst Catherine O'Brien and TD Cowen analyst Tom Fitzgerald raised their price targets across most major U.S.

Bank of America Securities (BofA) analyst Andrew G. Didora has adopted a more positive outlook on U.S. airlines ahead of second-quarter earnings, citing strong demand, stable fares, and lower fuel prices as key sector supports.

U.S. airlines' stocks are flying high as jet-fuel prices fall and Americans continue to take to the skies, with shares of United Airlines and Delta Air Lines zooming toward fresh records on Tuesday.

UAL adds first-ever U.S. nonstop flights to Cartagena from Houston and Washington Dulles, expanding its Colombia network and Latin America reach.

Key metrics vs top competitors for United Airlines Holdings, Inc. (UAL)
| Company | Price | Market Cap | P/E Ratio | Rev Growth (1Y) | Net Margin | ROE | Div Yield |
|---|---|---|---|---|---|---|---|
| $128.31 | $41.65B | 12.55 | 3.52% | 5.68% | 23.99% | — | |
| $88.63 | $58.23B | 11.57 | 2.79% | 6.87% | 23.14% | — | |
| $17.20 | $11.36B | 101.18 | 0.78% | 0.36% | — | — | |
| $49.43 | $24.27B | 62.57 | 2.11% | 2.83% | 10.67% | — | |
| $49.09 | $5.47B | 56.43 | 21.34% | 0.51% | 1.85% | — | |
| $5.72 | $2.13B | -3.45 | -2.34% | -7.78% | -33.13% | — |
United Airlines Holdings, Inc. (UAL) vs competitors — business, growth, and fundamentals comparison against the closest industry rivals.
United Airlines Holdings, Inc. (UAL) SEC filings — annual & quarterly reports (10-K, 10-Q)
May 22, 2026·SEC
Apr 27, 2026·SEC
Apr 21, 2026·SEC
Get notified when UAL posts new earnings or crosses analyst targets
Free. No account needed. Unsubscribe any time.
United Airlines Holdings, Inc. (UAL) stock FAQ — growth, dividends, profitability & financials explained
United Airlines Holdings, Inc. (UAL) reported $60.47B in revenue for fiscal year 2025. This represents a 270% increase from $16.36B in 1996.
United Airlines Holdings, Inc. (UAL) grew revenue by 3.5% over the past year. Growth has been modest.
Yes, United Airlines Holdings, Inc. (UAL) is profitable, generating $3.67B in net income for fiscal year 2025 (5.7% net margin).
United Airlines Holdings, Inc. (UAL) has a return on equity (ROE) of 24.0%. This is excellent, indicating efficient use of shareholder capital.
United Airlines Holdings, Inc. (UAL) generated $3.21B in free cash flow for fiscal year 2025. Positive FCF indicates the company can fund dividends, buybacks, or reinvestment.