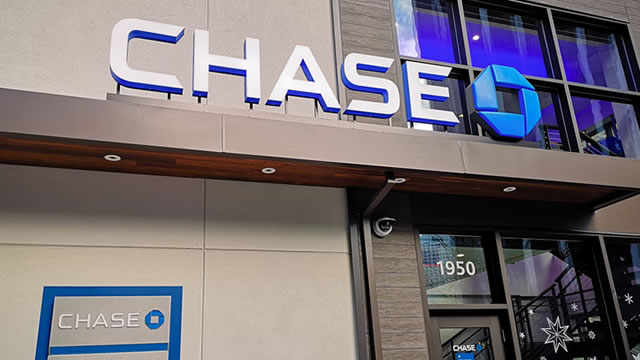
AboutJPMorgan Chase & Co. operates as a financial services company worldwide. It operates through four segments: Consumer & Community Banking (CCB), Corporate & Investment Bank (CIB), Commercial Banking (CB), and Asset & Wealth Management (AWM). The CCB segment offers s deposit, investment and lending products, payments, and services to consumers; lending, deposit, and cash management and payment solutions to small businesses; mortgage origination and servicing activities; residential mortgages and home equity loans; and credit card, auto loan, and leasing services. The CIB segment provides investment banking products and services, including corporate strategy and structure advisory, and equity and debt markets capital-raising services, as well as loan origination and syndication; payments and cross-border financing; and cash and derivative instruments, risk management solutions, prime brokerage, and research. This segment also offers securities services, including custody, fund accounting and administration, and securities lending products for asset managers, insurance companies, and public and private investment funds. The CB segment provides financial solutions, including lending, payments, investment banking, and asset management to small business, large and midsized companies, local governments, and nonprofit clients; and commercial real estate banking services to investors, developers, and owners of multifamily, office, retail, industrial, and affordable housing properties. The AWM segment offers multi-asset investment management solutions in equities, fixed income, alternatives, and money market funds to institutional clients and retail investors; and retirement products and services, brokerage, custody, trusts and estates, loans, mortgages, deposits, and investment management products. The company also provides ATM, online and mobile, and telephone banking services. JPMorgan Chase & Co. was founded in 1799 and is headquartered in New York, New York.Show more