VCP ScannerFree US Stock Screener & Financial AnalysisFree US Stock Screener
ScreenerThemes
DCF ValuationCalculate intrinsic value of US stocks
Market ValuationBuffett indicator, CAPE & macro gauges
Total ReturnSee dividends + price return history
DCA CalculatorSimulate recurring buys & compounding
Earnings
FAANG & Tech
AAPL vs MSFTNVDA vs AMDGOOGL vs META
Cloud & Cyber
CRM vs NOWCRWD vs PANWSNOW vs DDOG
Consumer & Auto
TSLA vs FAMZN vs WMTNFLX vs DIS
Finance & Crypto
JPM vs BACV vs MACOIN vs MSTR
Pharma & Energy
LLY vs NVOJNJ vs PFEXOM vs CVX
Compare Any Stocks...
WatchlistInsider
ScreenerThemes
Earnings
WatchlistInsider
HESM
← Back to Screener
VCP ScannerFree US Stock Screener & Financial Analysis

Find stocks. Verify deeply. Act with conviction.

Data updated daily

Product

  • Screener
  • Themes
  • Valuation
  • Total Return
  • DCA Calculator
  • News
  • Earnings

Resources

  • Market Valuation
  • Compare
  • Insider Activity
  • Methodology
  • How It Works
  • Glossary
  • Learn

Get Ideas

Get weekly stock ideas — free

© 2026 VCP Scanner
AboutPrivacyTerms
Not financial advice. Do your own research.
ScreenerNewsCompareWatchlist
HESMHess Midstream LP
$39.15$8.1B
Overview & Verdict
Overview
Valuation & Forecasts
Valuation ModelsEstimatesDCF Model
Price & Analyst Data
Analyst TargetsPrice HistoryTechnical Analysis
Financial Statements
Income StatementBalance SheetCash FlowRatios & Margins
Performance
P/E HistoryRevenue HistoryEarnings HistoryDividend HistoryTotal Return
Ownership
Holders

HESM logoHess Midstream LP(HESM)Earnings, Financials & Key Ratios

HESM•NYSE
$39.15
13.7× P/E·Price updated Jul 7, 2026
SectorEnergyIndustryMidstream Oil & GasSub-IndustryGas Gathering, Processing and NGLs
AboutHess Midstream LP owns, develops, operates, and acquires midstream assets. The company operates through three segments: Gathering; Processing and Storage; and Terminaling and Export. The Gathering segment owns natural gas gathering and compression; crude oil gathering systems; and produced water gathering and disposal facilities. Its gathering systems consists of approximately 1,350 miles of high and low pressure natural gas and natural gas liquids gathering pipelines with capacity of approximately 450 million cubic feet per day; and crude oil gathering system comprises approximately 550 miles of crude oil gathering pipelines. The Processing and Storage segment comprises Tioga Gas Plant, a natural gas processing and fractionation plant located in Tioga, North Dakota; a 50% interest in the Little Missouri 4 gas processing plant located in south of the Missouri River in McKenzie County, North Dakota; and Mentor Storage Terminal, a propane storage cavern and rail, and truck loading and unloading facility located in Mentor, Minnesota. The Terminaling and Export segment owns Ramberg terminal facility; Tioga rail terminal; and crude oil rail cars, as well as Johnson's Corner Header System, a crude oil pipeline header system. Hess Midstream LP was founded in 2014 and is based in Houston, Texas.Show more
  • Revenue$1.62B+8.7%
  • EBITDA$1.22B+8.9%
  • Net Income$353M+58.2%
  • EPS (Diluted)2.86+14.9%
  • Gross Margin63.94%-26.0%
  • EBITDA Margin75.38%+0.2%
  • Operating Margin62.18%+0.9%
  • Net Margin21.77%+45.6%
  • ROE78.14%+45.1%

HESM Price & Volume

Hess Midstream LP (HESM) stock price & volume — 10-year historical chart

Loading chart...

Maturing Growth Profiles Challenge Capital Return Sustainability

Investment Thesis • Updated 2026Q1

VerdictNeutral
Growth:Decelerating
Profitability:Strong
Financial:Strained
Cash Flow:Stable
Primary Risk:Sponsor-dependent capital structure

Key Thesis Takeaways

  • Hess Midstream LP faces a transition from high-growth expansion to a mature phase characterized by decelerating revenue growth and structural margin compression.
  • While the company maintains consistent operating margins above 60%, its aggressive capital return strategy, often exceeding free cash flow, creates significant pressure on a balance sheet already strained by a 10.06 debt-to-equity ratio.
  • Investors should monitor the sustainability of these distributions against the backdrop of limited liquidity and the inherent volume risks associated with its Williston Basin infrastructure.

Verdict Logic

while the 7.6% dividend yield is attractive, the combination of a 10.06 debt-to-equity ratio and capital returns that frequently exceed free cash flow suggests limited margin for error in the event of operational volatility.

HESM Growth Metrics

Hess Midstream LP (HESM) revenue, earnings & EPS growth — 3, 5 & 10-year CAGR

Revenue CAGR

10 Years11.12%
5 Years8.23%
3 Years8.39%
TTM7.28%

Profit CAGR

10 Years6.2%
5 Years71.19%
3 Years61.42%
TTM47.5%

EPS CAGR

10 Years-2.11%
5 Years16.9%
3 Years12.48%
TTM13.33%

Return on Capital

10 Years18.49%
5 Years23.64%
3 Years24.19%
Last Year24.79%

HESM Recent Earnings

Hess Midstream LP (HESM) EPS & revenue vs analyst estimates — last 4 quarters

Full history →
●Beat EPS 7/12 qtrs (58%)●Beat Revenue 7/12 qtrs (58%)
Q2 2026Latest
May 4, 2026
Metric
Actual
Est
EPS
$0.68+4.6%
$0.65
Rev
$390M+0.2%
$390M
Q1 2026
Feb 2, 2026
Metric
Actual
Est
EPS
$0.72-0.4%
$0.72
Rev
$404M-3.6%
$419M
Q4 2025
Nov 3, 2025
Metric
Actual
Est
EPS
$0.75+2.6%
$0.73
Rev
$421M+0.7%
$418M
Q3 2025
Jul 30, 2025
Metric
Actual
Est
EPS
$0.74+32.1%
$0.56
Rev
$414M-3.7%
$429M
QuarterDateEPS (Act vs Est)Revenue (Act vs Est)
Q2 2026LatestMay 4, 2026
$0.68vs $0.65+4.6%
$390Mvs $390M+0.2%
Q1 2026Feb 2, 2026
$0.72vs $0.72-0.4%
$404Mvs $419M-3.6%
Q4 2025Nov 3, 2025
$0.75vs $0.73+2.6%
$421Mvs $418M+0.7%
Q3 2025Jul 30, 2025
$0.74vs $0.56+32.1%
$414Mvs $429M-3.7%
Based on last 12 quarters of dataView full earnings history →

Latest HESM News

Recent stock market news and headlines for Hess Midstream LP (HESM)

Forbes·2 days ago
Dividend Growth Stock List: 8 Names Yielding Up To 8.3%

Wall Street analysts have one job: predict where companies' earnings are going in the coming quarter. Sounds simple enough, except said suits aren't so good at it!

Seeking Alpha·6 days ago
Hess Midstream LP: Transitioning From Growth Spending To Shareholder Return

Hess Midstream LP is transitioning from heavy infrastructure investment to maximizing cash generation and increasing shareholder returns, forming the basis for my Buy rating. HESM's fee-based business model, supported by long-term agreements and minimum volume commitments, underpins dependable cash flows and sustainable distribution growth. Management targets at least 5% annual distribution growth through 2028, alongside disciplined unit repurchases, prudent debt management, and selective acquisitions.

Seeking Alpha·Jun 23, 2026
Hess Midstream: Attractive Even Without An Iran Benefit

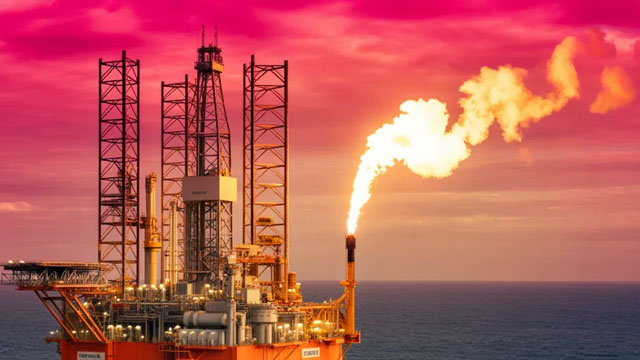
Hess Midstream remains a "Strong Buy," offering an 8.5% yield and at least 15% upside, despite recent underperformance and Bakken drilling headwinds. HESM's long-term contract with Chevron through 2033, with annual CPI-linked fee escalators, secures stable cash flow and mitigates near-term oil price and volume risks. Free cash flow yield stands at ~13%, supported by reduced capex, growing third-party revenues, and robust EBITDA margins of 83%.
Seeking Alpha·Jun 20, 2026
Buy The Dip: 8%+ Yields Getting Way Too Cheap

There are some highly compelling 8%+ yields available today. I detail 2 of them in this article that are often overlooked, yet have solid balance sheets, promising growth potential, and strong coverage. I also share some of the risks to keep in mind.

Peers Comparison

Key metrics vs top competitors for Hess Midstream LP (HESM)

Full Screener →
CompanyPriceMarket CapP/E RatioRev Growth (1Y)Net MarginROEDiv Yield
HESM logoHESMHess Midstream LPCurrent
$39.15$8.09B13.698.67%21.77%78.14%7.27%
TRGP logoTRGPTarga Resources Corp.
$273.81$58.77B32.143.06%12.98%70.77%—
DKL logoDKLDelek Logistics Partners, LP
$53.55$2.85B16.237.73%16%1917.1%—
WES logoWESWestern Midstream Partners, LP
$44.80$17.64B14.936.61%29.9%33.79%—
AM logoAMAntero Midstream Corporation
$22.71$10.79B26.416.99%31.94%20.38%—
MPLX logoMPLXMPLX Lp
$57.51$58.38B11.938.37%37.54%32.81%—

Compare HESM vs Peers

Hess Midstream LP (HESM) vs competitors — business, growth, and fundamentals comparison against the closest industry rivals.

Closest Rival

vs TRGP

Most directly comparable listed peer for HESM.

Scale Benchmark

vs CVX

Larger-name benchmark to compare HESM against a more recognizable public peer.

Peer Set

Compare Top 5

vs TRGP, DKL, WES, AM

HESM SEC Filings & Documents

Hess Midstream LP (HESM) SEC filings — annual & quarterly reports (10-K, 10-Q)

8-K Announcements

6
Material company update

May 4, 2026·SEC

Material company update

Mar 4, 2026·SEC

Material company update

Feb 2, 2026·SEC

10-K Annual Reports

3
FY 2026

Feb 25, 2026·SEC

FY 2025

Feb 27, 2025·SEC

FY 2024

Feb 29, 2024·SEC

10-Q Quarterly Reports

6
FY 2026

May 7, 2026·SEC

FY 2025

Nov 6, 2025·SEC

FY 2025

Aug 6, 2025·SEC

Get notified when HESM posts new earnings or crosses analyst targets

Free. No account needed. Unsubscribe any time.

Free. Unsubscribe any time.

HESM Frequently Asked Questions

Hess Midstream LP (HESM) stock FAQ — growth, dividends, profitability & financials explained

Growth & Financials
What is Hess Midstream LP's revenue?

Hess Midstream LP (HESM) reported $1.63B in revenue for fiscal year 2025. This represents a 860% increase from $169.7M in 2012.

How fast is Hess Midstream LP growing?

Hess Midstream LP (HESM) grew revenue by 8.7% over the past year. This is steady growth.

Is HESM profitable?

Yes, Hess Midstream LP (HESM) is profitable, generating $368.9M in net income for fiscal year 2025 (21.8% net margin).

Dividend & Returns
Does HESM pay dividends?

Yes, Hess Midstream LP (HESM) pays a dividend with a yield of 7.27%. This makes it attractive for income-focused investors.

What is HESM's return on equity?

Hess Midstream LP (HESM) has a return on equity (ROE) of 78.1%. This is excellent, indicating efficient use of shareholder capital.

What is Hess Midstream LP's free cash flow?

Hess Midstream LP (HESM) generated $652.4M in free cash flow for fiscal year 2025. Positive FCF indicates the company can fund dividends, buybacks, or reinvestment.


What if you invested $1,000 in HESM back in 2012?

Total return calculator · dividends reinvested · 14+ years of data

See returns →