Zacks Investment Research·5 days ago
Here's Why APA (APA) is a Strong Growth StockThe Zacks Style Scores offers investors a way to easily find top-rated stocks based on their investing style. Here's why you should take advantage.
 APA Corporation(APA)Earnings, Financials & Key Ratios
APA Corporation (APA) stock price & volume — 10-year historical chart
Investment Thesis • Updated 2026Q1
while the company has improved its debt-to-equity ratio to 0.60, the persistent volatility in free cash flow and the 11.7% revenue contraction in 2026Q1 suggest that operational risks remain elevated.
APA Corporation (APA) revenue, earnings & EPS growth — 3, 5 & 10-year CAGR
APA Corporation (APA) EPS & revenue vs analyst estimates — last 4 quarters
| Quarter | Date | EPS (Act vs Est) | Revenue (Act vs Est) |
|---|---|---|---|
| Q2 2026Latest | May 6, 2026 | $1.38vs $1.11+24.3% | $2.2Bvs $2.1B+3.8% |
| Q1 2026 | Feb 25, 2026 | $0.91vs $0.64+41.3% | $2.0Bvs $1.8B+12.1% |
| Q4 2025 | Nov 5, 2025 | $0.93vs $0.79+17.3% | $2.1Bvs $2.1B+2.7% |
| Q3 2025 | Aug 6, 2025 | $0.87vs $0.45+93.3% | $2.2Bvs $2.1B+5.6% |
Recent stock market news and headlines for APA Corporation (APA)
The Zacks Style Scores offers investors a way to easily find top-rated stocks based on their investing style. Here's why you should take advantage.
In the most recent trading session, APA (APA) closed at $33.01, indicating a -1.23% shift from the previous trading day.
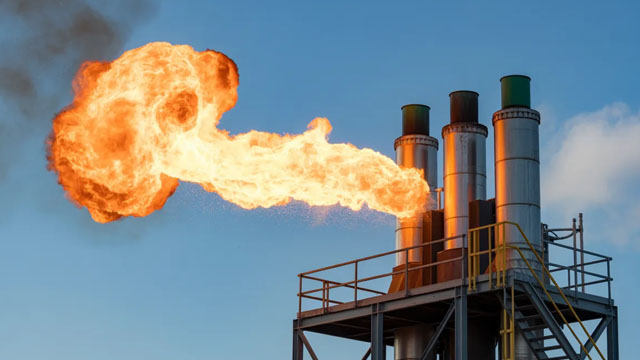
In its current form, APA trades at a significant discount to Permian focused companies. This discount is not reflective of the growth potential held by both Suriname or Alaskan development programs. The company continues to trade at double digit free cash flow yields. This figure should only improve after the GranMorgu project is online.

APA , W&T and Ring have been highlighted in this Industry Outlook article.

Following a careful analysis of the Zacks Oil and Gas - Exploration and Production - United States industry, we advise tracking shares of APA, WTI and REI.

Key metrics vs top competitors for APA Corporation (APA)
| Company | Price | Market Cap | P/E Ratio | Rev Growth (1Y) | Net Margin | ROE | Div Yield |
|---|---|---|---|---|---|---|---|
| $32.46 | $11.47B | 8.14 | -8.39% | 16.08% | 21.46% | 3.09% | |
| $40.36 | $25.08B | 9.61 | 10.01% | 17.55% | 18.6% | — | |
| $103.58 | $126.25B | 16.31 | 7.51% | 12.56% | 11.29% | — | |
| $53.30 | $14.98B | 11.15 | -4.55% | 8.62% | 7.11% | — | |
| $32.56 | $24.72B | 14.47 | -49.62% | 25.71% | 11.26% | — | |
| $18.19 | $15.06B | 14.21 | 1.29% | 17.61% | 5.77% | — |
APA Corporation (APA) vs competitors — business, growth, and fundamentals comparison against the closest industry rivals.
APA Corporation (APA) SEC filings — annual & quarterly reports (10-K, 10-Q)
May 6, 2026·SEC
Apr 14, 2026·SEC
Feb 25, 2026·SEC
Get notified when APA posts new earnings or crosses analyst targets
Free. No account needed. Unsubscribe any time.
APA Corporation (APA) stock FAQ — growth, dividends, profitability & financials explained
APA Corporation (APA) reported $8.61B in revenue for fiscal year 2025. This represents a 782% increase from $976.0M in 1996.
APA Corporation (APA) saw revenue decline by 8.4% over the past year.
Yes, APA Corporation (APA) is profitable, generating $1.53B in net income for fiscal year 2025 (16.1% net margin).
Yes, APA Corporation (APA) pays a dividend with a yield of 3.09%. This makes it attractive for income-focused investors.
APA Corporation (APA) has a return on equity (ROE) of 21.5%. This is excellent, indicating efficient use of shareholder capital.
APA Corporation (APA) generated $1.49B in free cash flow for fiscal year 2025. Positive FCF indicates the company can fund dividends, buybacks, or reinvestment.